

Queensland Severe Storm potential on Saturday 1st November 2025
Weather situation:
A moist and unstable atmosphere will sit on the east of a trough line, when this trough interacts with this unstable air, Thunderstorms are expected to form. These storm have the potential to be severe, including Supercells. Possible Hazards:
- Damaging wind gust, Locally Destructive.
- Heavy Rainfall
- Large, possibly giant hail stones
- Slight risk of tornadoes with any supercells (<2%)
Lets break down in to more details. Analysing the individual indicators.
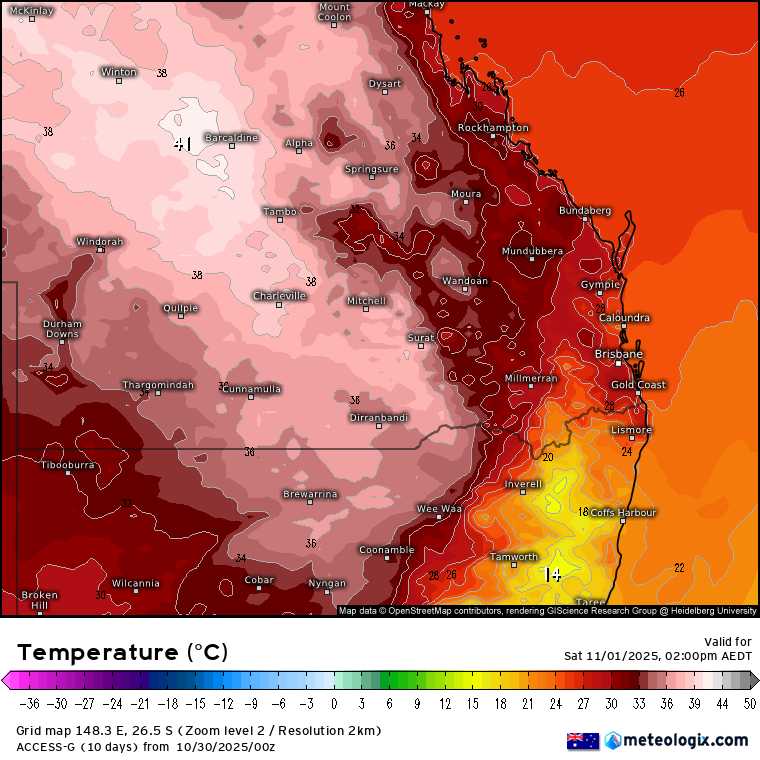
Afternoon temperatures are expected to be in the high 20s over Brisbane, tending to low to high 30s in the west and west of the ranges. This provides enough heat for convection.
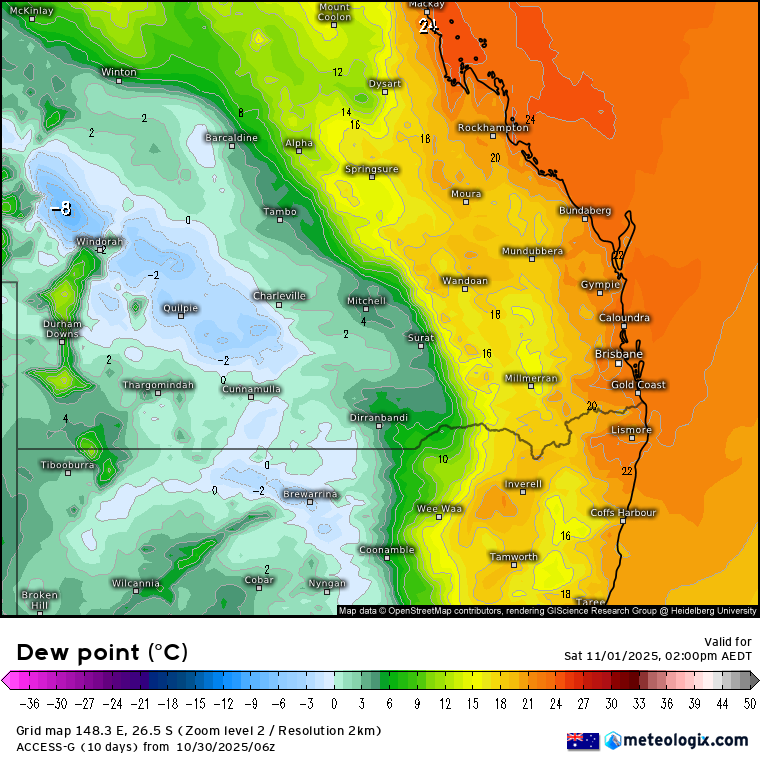
Dew points are expected to be decent across the regon and in this image you can see a clear dry line where storms should initiate.
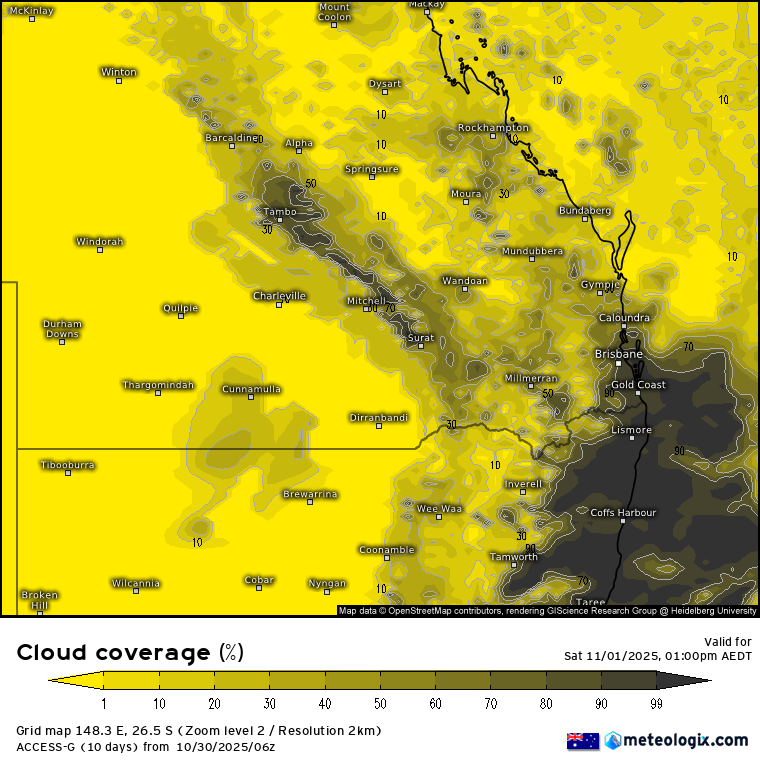
In this next model, we will look at expected cloud cover, and we see in a line from Tambo to Surat of increased cloud cover, further reinforcing the outlook of storms forming in this general area.
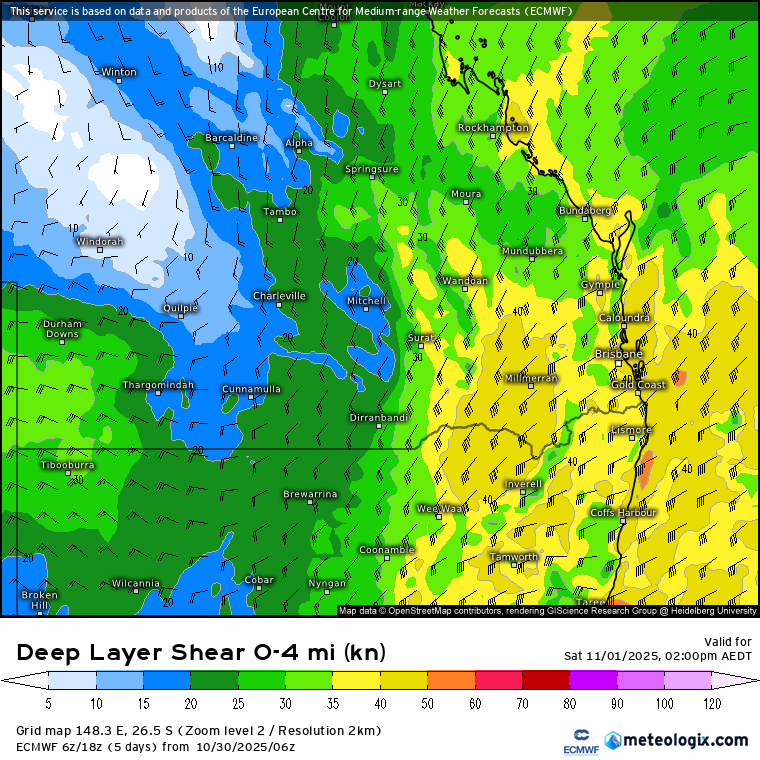
Next we look at Deep layer sheer, which is fairly decent, meaning Supercell development is possible. With many areas of 35 knots or higher. This is a key indicator we look for in forecasting what type of storms will form.
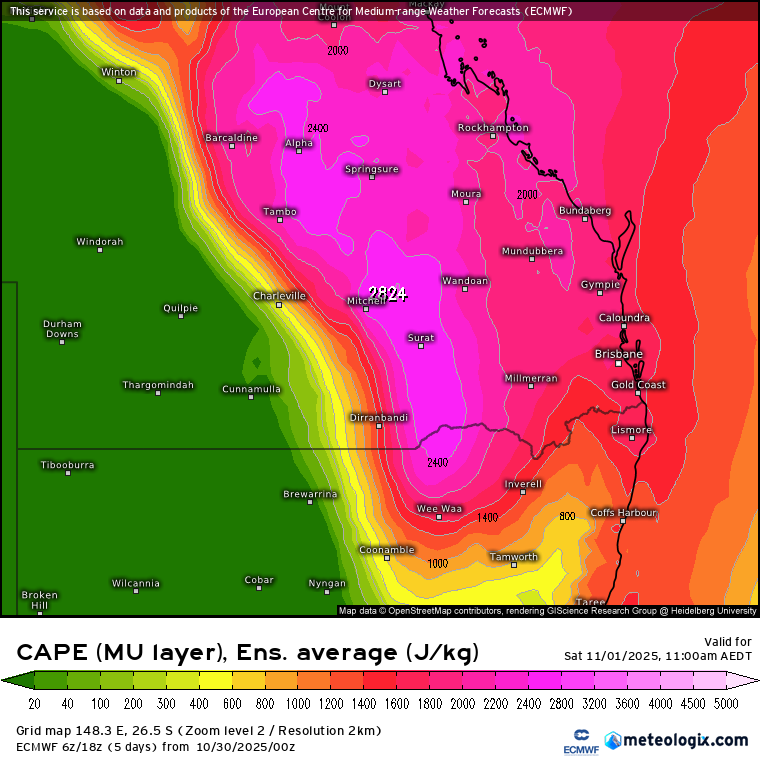
Next is the inexperienced forecasters favourite value…CAPE. High values of CAPE mean high instability but High levels of CAPE do not automatically mean storms. However in this case, we have other perimeters being met as will be explained. Heres the CAPE value.
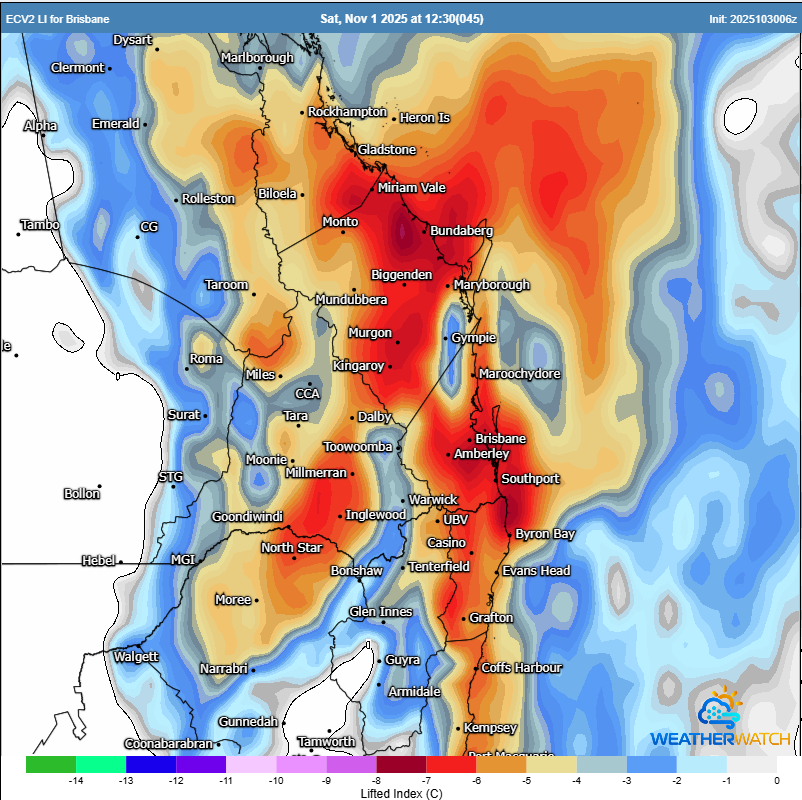
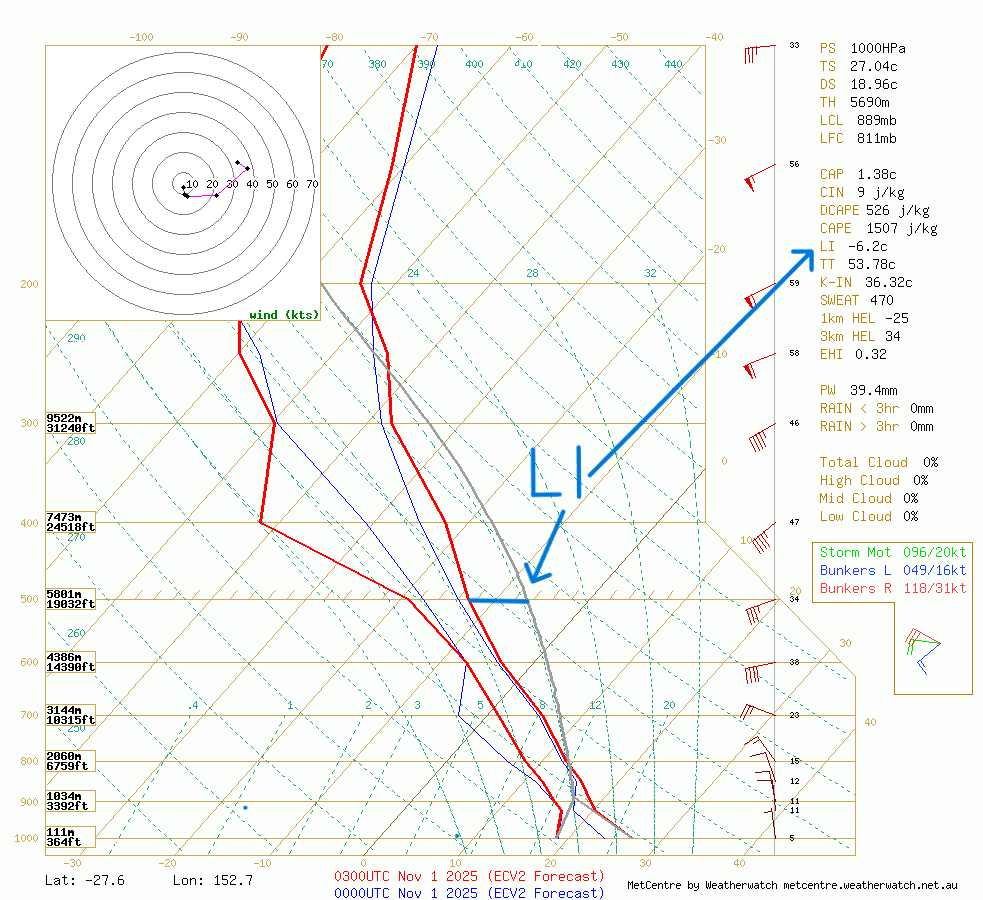
Lifted Index (LI) is another measure that is often misunderstood. I’ll have two images to explain this one. LI is the temperature difference between a theoretical air parcel rising and the air temperature of the relevant level, it is typically used to work out how fast the air will rise, a lower number meaning a faster lapse rate. The LI is typically calculation at the 500hPa pressure level of the atmosphere (Fig 2). Once again LI on its own is not a good way of forecasting storms as a low LI does not automatically mean storms. However in the case of Saturday, it matches other indicators meaning it couples with them and reinforces the forecast. Heres the LI for Sat (Fig1 ) at
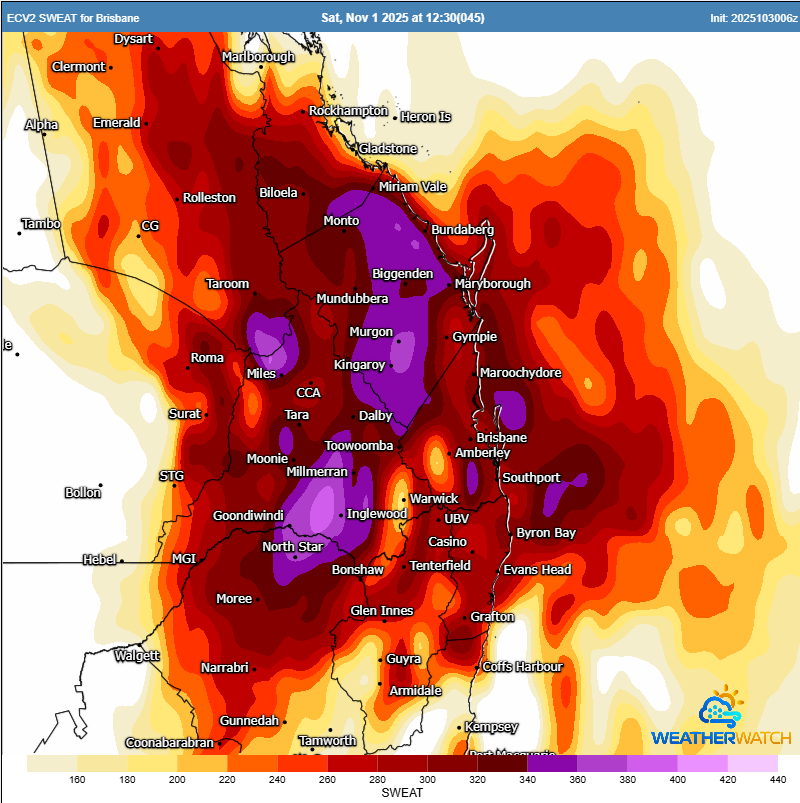
Next we will look at Saturdays SWEAT index, and for educational purposes: Values above 300 indicate potential for severe Thunderstorms, Values above 400 can in some cases indicate a higher risk of Tornadoes. On Saturday EC is showing a peak value of 380 to 400, this is why I have included the chance of Tornadoes even if extremely low chance. It is not fear mongering but simply telling the public there is a very low chance as any responsible forecaster would.
There are many other indicators I could go through but these are the main ones but this is simply a guidance at this time and Jason will go in to more detail sometime on Friday.
There are also a few problems we could face, cloud cover being the biggest, if cloud doesn’t clear early from any previous days activity, it could suppress or decrease the severity of storms.
Conclusion:
Saturday is a day to watch with Supercell potential across the SEQ and NENSW region. Storms are likely to form on a dry line west of the ranges and move East during the arvo. As is the nature with storms, some will miss out others will not. Exact locations are very hard to pin point so the best thing to so is watch for warnings and follow the live stream I will likely do on Saturday for Severe Storm coverage.
Nikko