
Wet Season 2024/25 Overview.
How did the wet season 2024/25 perform against average. In this article I will touch on the basic overview of rainfall, temperatures, and Tropical cyclones. This will include QLD, NT and WA above the latitude of 23.5 degrees south (Locations south of that line will be covered in a spring/summer weather overview separately). I’ll show Observed v Averages for the full wet season and number of Tropical Cyclones against average. The wet season runs from October to April across most of the tropical north. Naturally all temperatures are in Celsius. I won’t be including every city or town however I will be including maps so you can pin point where you live and see how your area performed against average. Please note that not all places listed have Tropical Climates, they are just within the Tropic Zone (Between 23.5 degrees south and the equator).
NT
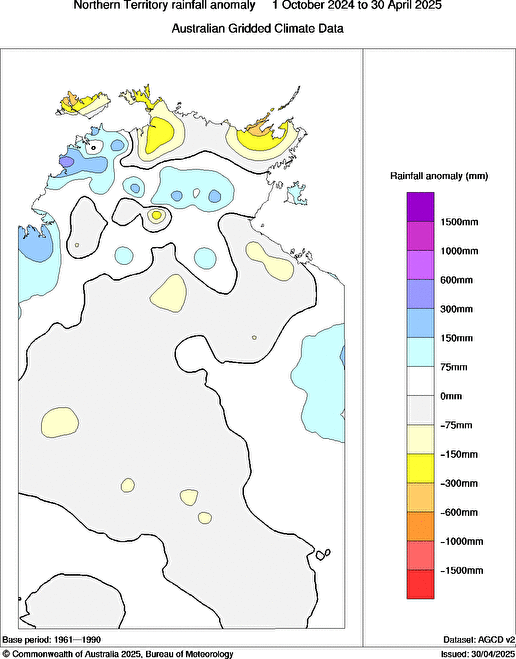
The top end of the NT started off the wet season on a high, with above average rainfall seen across almost the whole region. Darwin missed out on most of the rainfall but the greater Darwin area didn’t. Most of the Eastern Top end saw above average rainfall as well except for the far east.. In the south mostly below average rainfall occurred. Over the next few months the Top end saw an increase in Rainfall from Storm activity. January was a fairly dry month overall due to no monsoonal activity lasting more then a day. The monsoon finally arrived on the 7th Feb which was the latest onset on record. The last couple months were above average for most of the Western top end. The eastern top end was mostly drier then average however some locations ended on a high with the far east seeing a few hundred mm above average. The outback was drier especially further south.
| Location | Wet 24/25 | Average | Anomaly |
| Darwin | 1,911.4mm | 1,684.1mm | +227.3mm |
| Middle Point | 1,375mm | 1.345.2mm | +29.8mm |
| Dum in Mirrie | 1,652.8mm | 1,699.7mm | -46.9mm |
| Gunn Point* | 1,541.1mm | 1,768.7mm | -227.6mm |
| Pirlangimpi | 1,003mm | 1,899mm | -896mm |
| Nhulunbuy | 1,703.6mm | 1,290.6mm | +413mm |
| Katherine** | 1,108.4mm | 1,023.3mm | +85.1mm |
| Tennant Creek | 294.4mm | 447.5mm | -153.1mm |
| Alice Springs | 110.6mm | 222.2mm | -111.6mm |
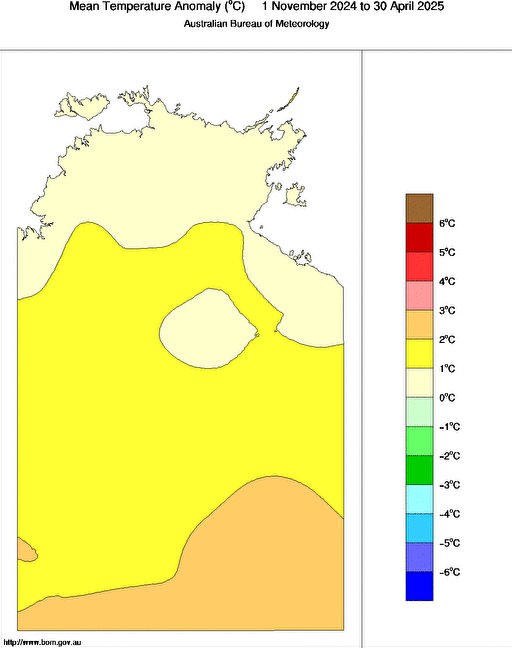
Temperatures were warmer across the whole of the NT. With the highest anomalies seen in the southern areas of the Territory. Here’s the same towns but this time Observed mean temps v Average.
| Location | Wet 24/25 | Average | Anomaly |
| Darwin | 29.3 | 28.7 | +0.6 |
| Middle Point | 29.6 | 29.2 | +0.4 |
| Dum in Mirrie | 30 | 29 | +1 |
| Gunn Point* | 29.2 | 28.7 | +0.5 |
| Pirlangimpi | 29.4 | 28.5 | +0.9 |
| Nhulunbuy | 28.5 | 28 | +0.5 |
| Katherine** | 30.2 | 29.6 | +0.6 |
| Tennant Creek | 30.6 | 29.5 | +1.1 |
| Alice Springs | 27.7 | 25.7 | +2 |
Below are the maps.
QLD
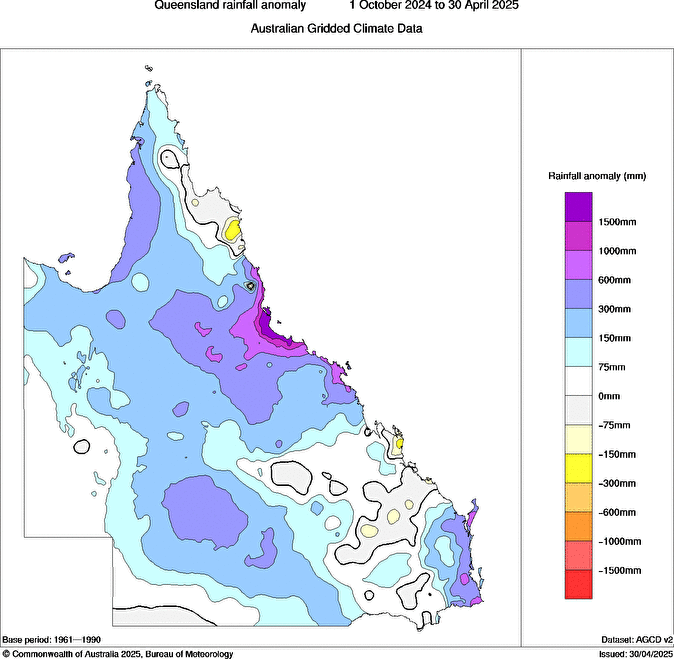
For the Queensland areas north of the Tropic of Capricorn. Rainfall was fairly low for most areas to begin with. The area around Mackay did ok and so did the far north of FNQ. The NW did not to bad either, however later in the wet, things really ramped up especially for the North Queenslands coast, where Townsville saw its Wettest wet season on record with a massive 2,012.7mm above the wet season average. That’s 290% of the average for a wet season. I would be impressed by that percentage in a single month but to get that much over average across 7 months is incredible. Other areas also saw massive falls, especially around the Ingham and Cardwell areas. Here are the observations v Average.
| Location | Wet 24/25 | Average | Anomaly |
| Rockhampton | 663mm | 639.1mm | +23.9mm |
| Gladstone | 521.8mm | 690.6mm | -168.8mm |
| Mackay | 1,737.4mm | 1,322.7mm | +414.7mm |
| Townsville | 3,072.8mm | 1,060.1mm | +2,012.7mm |
| Cairns | 2,332.4mm | 1,791.4mm | +541mm |
| Cooktown | 1,261.2mm | 1,477.6mm | -216.4mm |
| Weipa | 1,988.8mm | 1,923.4mm | +65.4mm |
| Cloncurry | 434.2mm | 482.3mm | -48.1mm |
| Mt Isa | 504.2mm | 420.6mm | +83.6mm |
Temperatures were above average right across the state, with the hotter temperature anomalies in the west. Here’s the table of Obs v Average means.
| Location | Wet 24/25 | Average | Anomaly |
| Rockhampton | 26.6 | 26.3 | +0.3 |
| Gladstone | 26.8 | 25.6 | +1.2 |
| Mackay | 26.3 | 25.6 | +0.7 |
| Townsville | 27.5 | 26.8 | +0.7 |
| Cairns | 27.5 | 26.7 | +0.6 |
| Cooktown | 28 | 27.6 | +0.4 |
| Weipa | 29 | 28.5 | +0.5 |
| Cloncurry | 30.4 | 29.8 | +0.6 |
| Mt Isa | 29.3 | 27.8 | +1.5 |
Below are the Queensland Anomaly maps.

WA
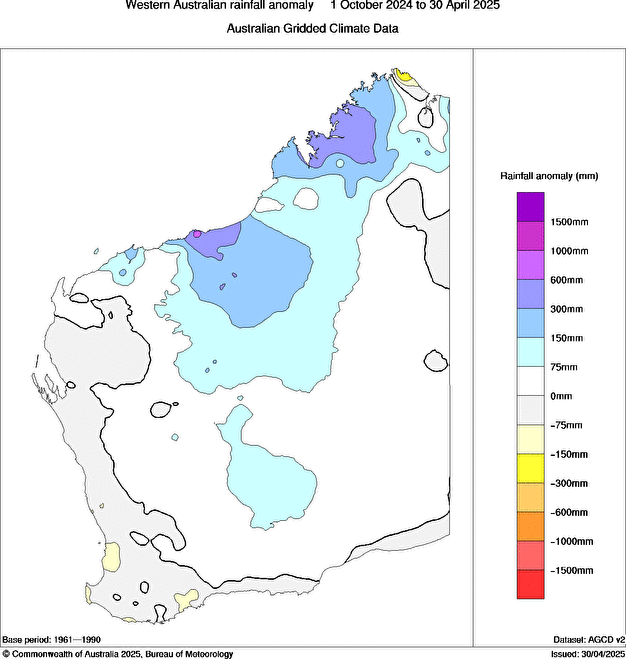
Over in WA, Most places saw decent rainfall thanks to a few Tropical Cyclones or Tropical Lows drifting over the area. The NE area saw less rain due to a poor monsoon season.
| Location | Wet 24/25 | Average | Anomaly |
| Kununurra | 773.4mm | 829.9mm | -56.5mm |
| Halls Creek | 488.2mm | 547.8mm | -59.6 |
| Fitzroy Crossing | 711.2mm | 646.3mm | +64.9mm |
| Derby | 983.2mm | 663.9mm | +319.3mm |
| Broome | 715.8mm | 576.5mm | +139.3mm |
| Port Hedland | 411.6mm | 249.4mm | +162.2mm |
| Marble Bar | 268.2mm | 337.7mm | -69.5mm |
| Karratha | 451.6mm | 204.9mm | +246.7mm |
| Onslow | 227.6mm | 180.1mm | +47.5mm |
Temperatures where above average across the region although some areas saw cooler maximums but higher minimums due to consistent cloud cover. However when all mins and maxs are added together and averaged out over 7 months, the minimums were high enough to bring the overall mean above average for all locations listed.
| Location | Wet 24/25 | Average | Anomaly |
| Kununurra | 31 | 30.6 | +0.4 |
| Halls Creek | 30.5 | 29.9 | +0.6 |
| Fitzroy Crossing | 31.7 | 31.3 | +0.4 |
| Derby | 31.1 | 30.6 | +0.5 |
| Broome | 30.4 | 29.3 | +1.1 |
| Port Hedland | 31.4 | 29.7 | +1.7 |
| Marble Bar | 32.7 | 32 | +0.7 |
| Karratha | 31.7 | 30.1 | +1.6 |
| Onslow | 30.9 | 29.5 | +1.4 |
Here’s the maps for the anomalies.

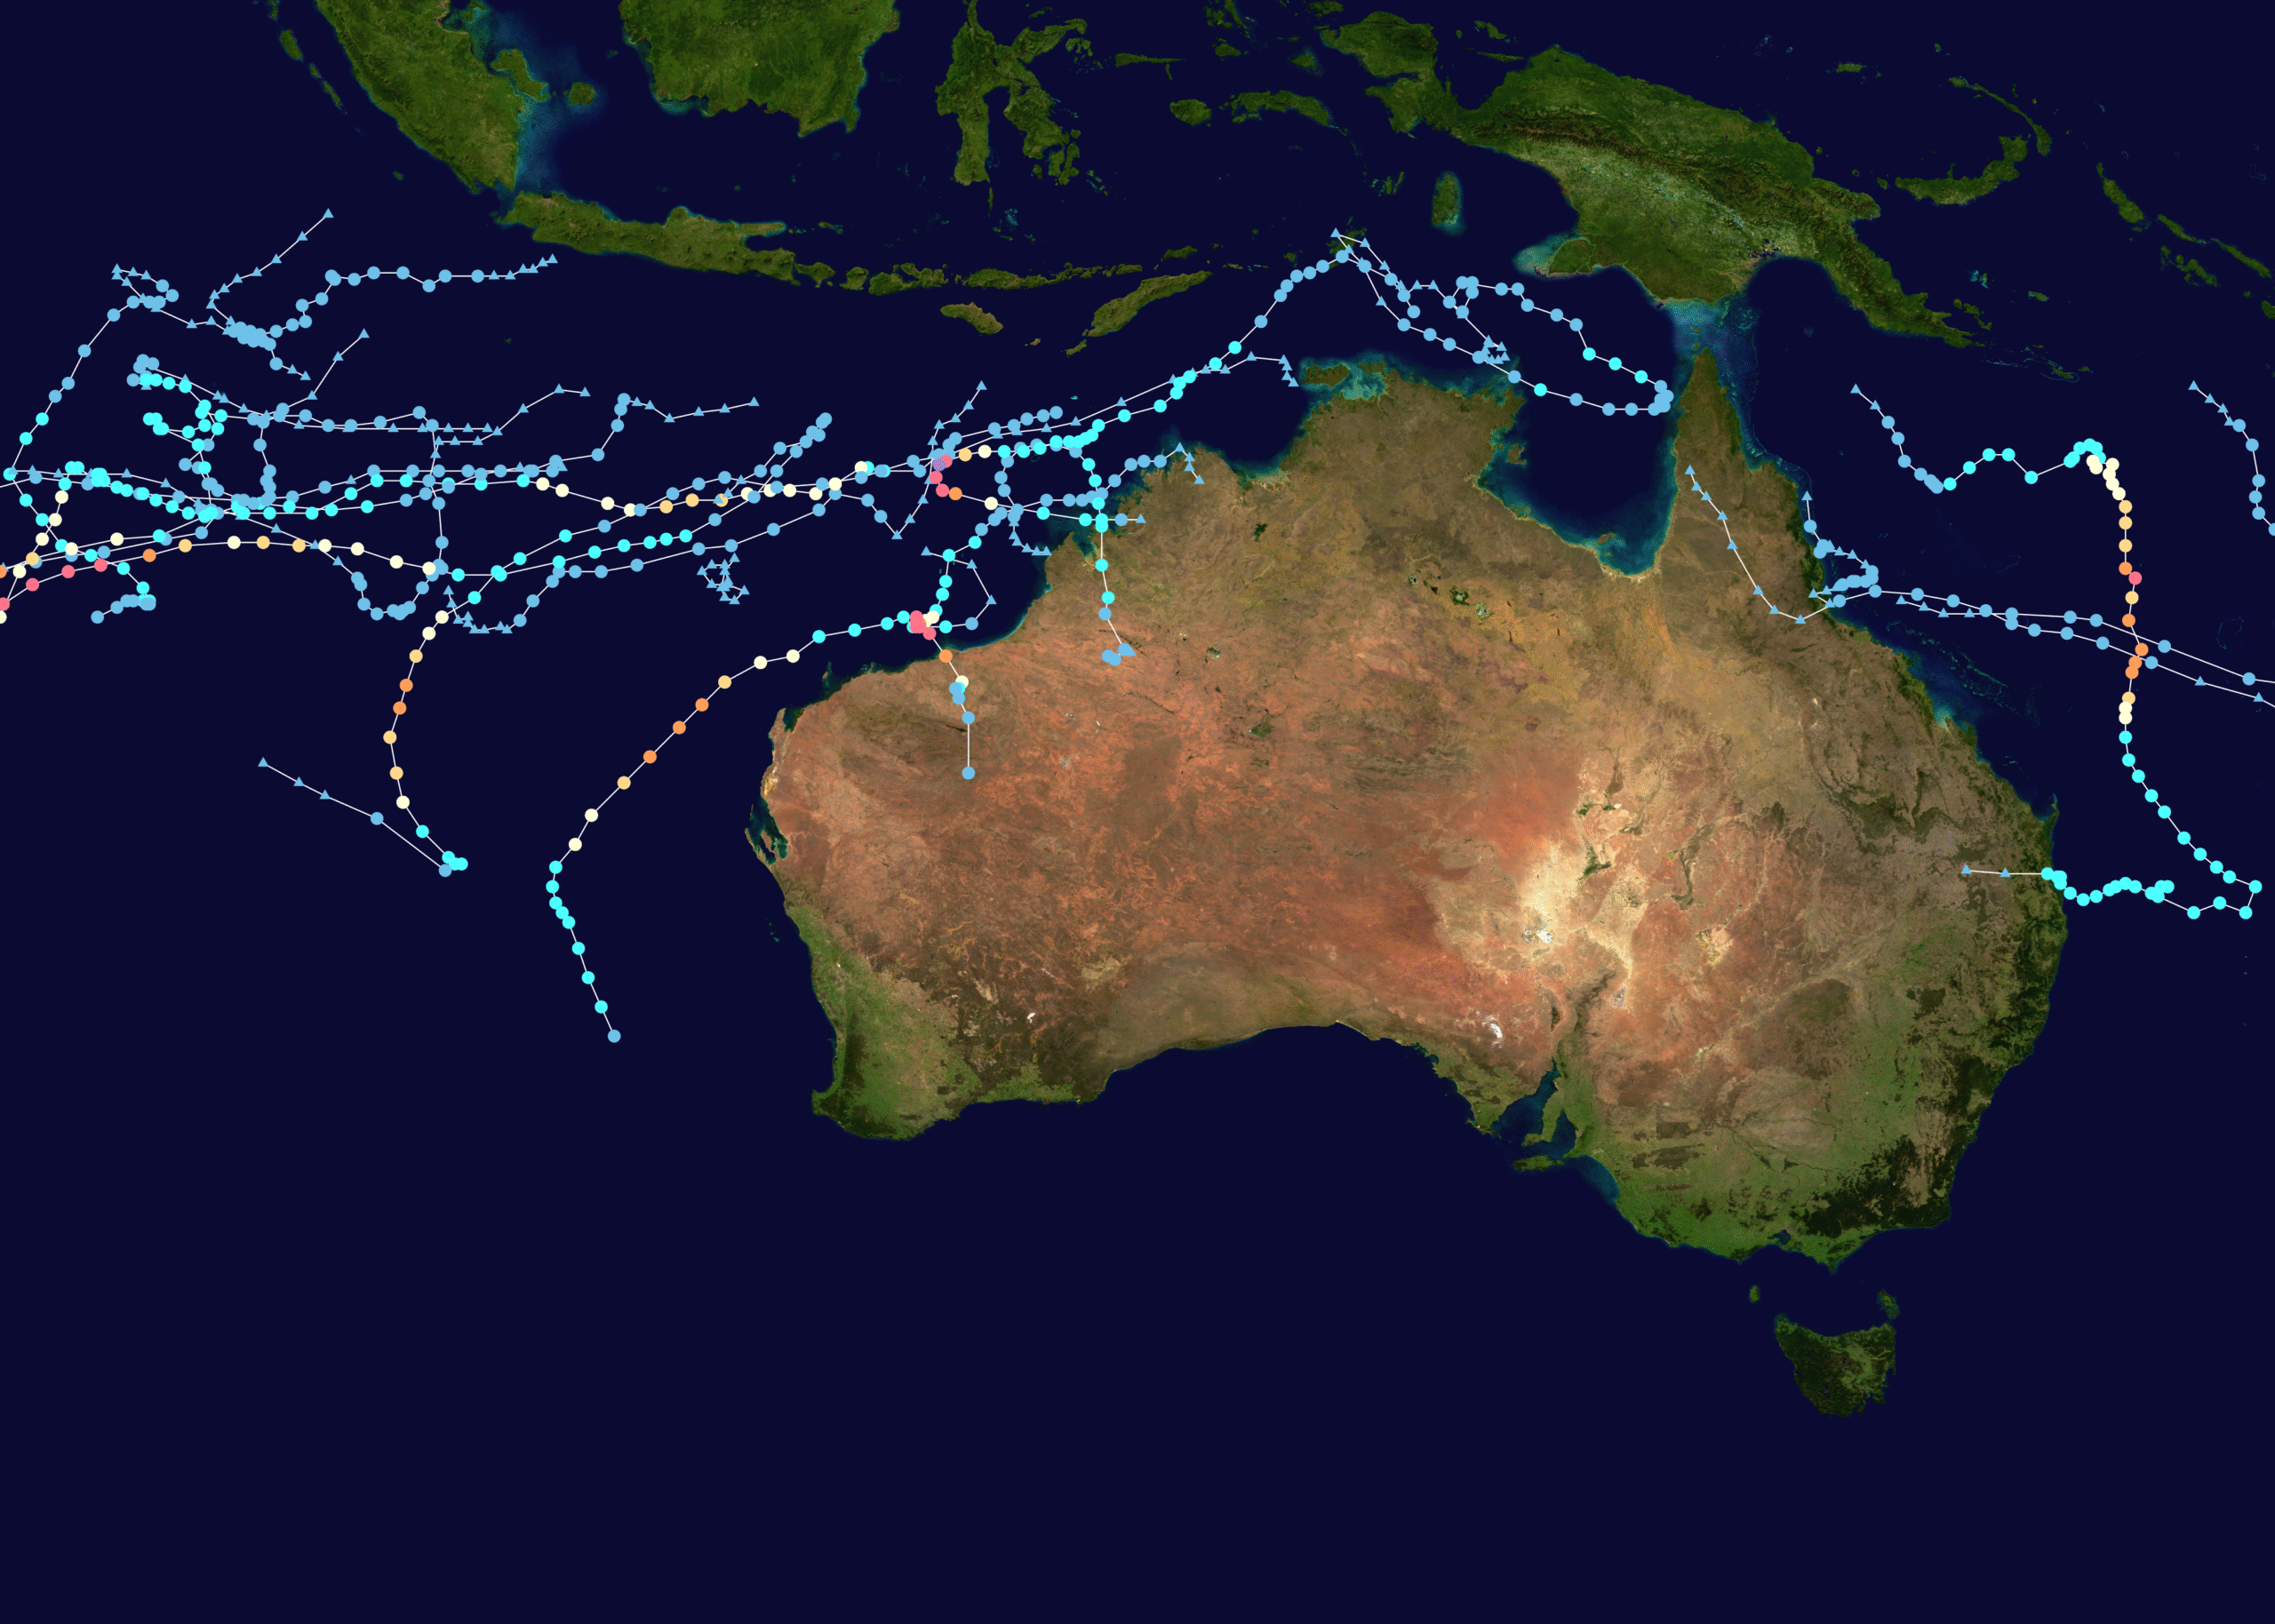
Tropical Lows and Tropical Cyclones
| 2024/25 | Average | |
| Tropical Lows | 26 | N/A |
| Tropical Cyclones | 12 | 11 |
| Severe Tropical Cyclones | 8 | 4 |
Season Forecast and Season Overview
The BoM predicted there would be slightly below average numbers of Cyclones and my personal forecast had similar predictions. This was based on recent trends where even though SSTs were looking good, average numbers had been below average, so that trend was expected pre Season.
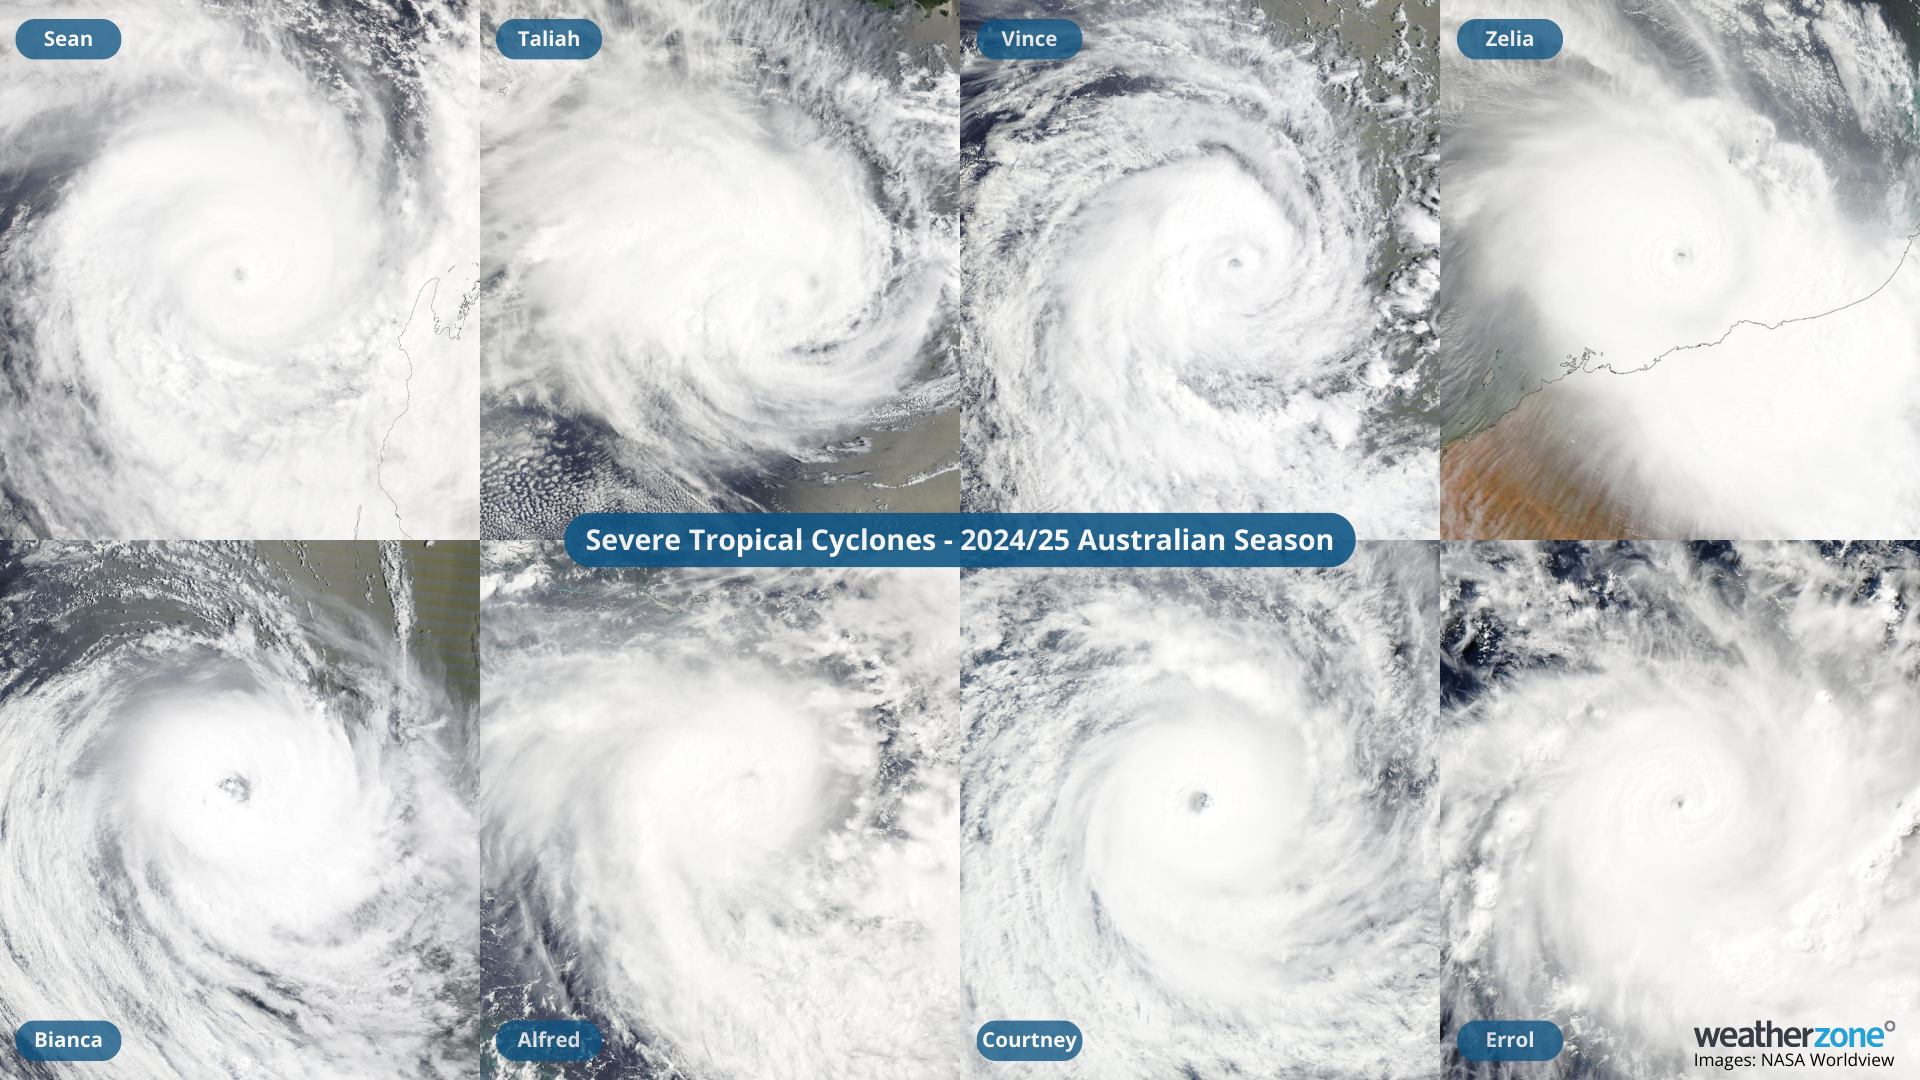
In the end the season ended up slightly above average for total Tropical Cyclones and 200% above average for Severe Tropical Cyclones. The season was pretty busy with very little gaps between Systems and many over lapping each other. There were 14 Tropical Lows that failed to intensify in to Tropical Cyclone.
Tropical Cyclones and their individual overview***.
Tropical Cyclone Robyn
19 Nov – 30 Nov
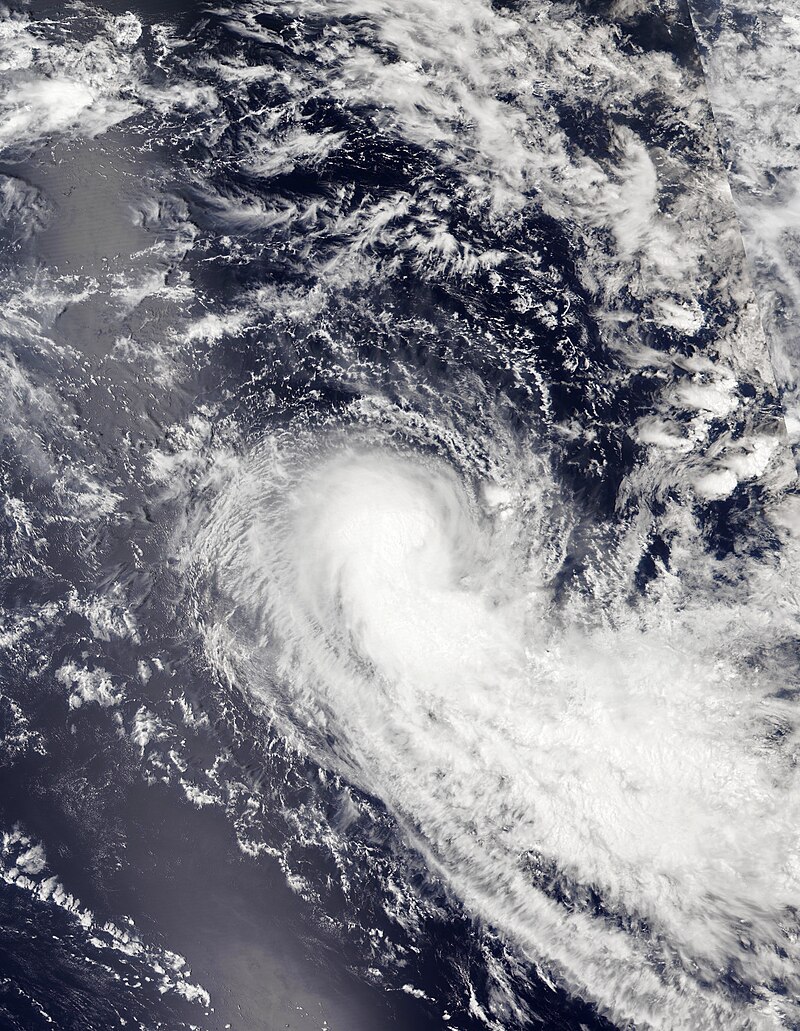
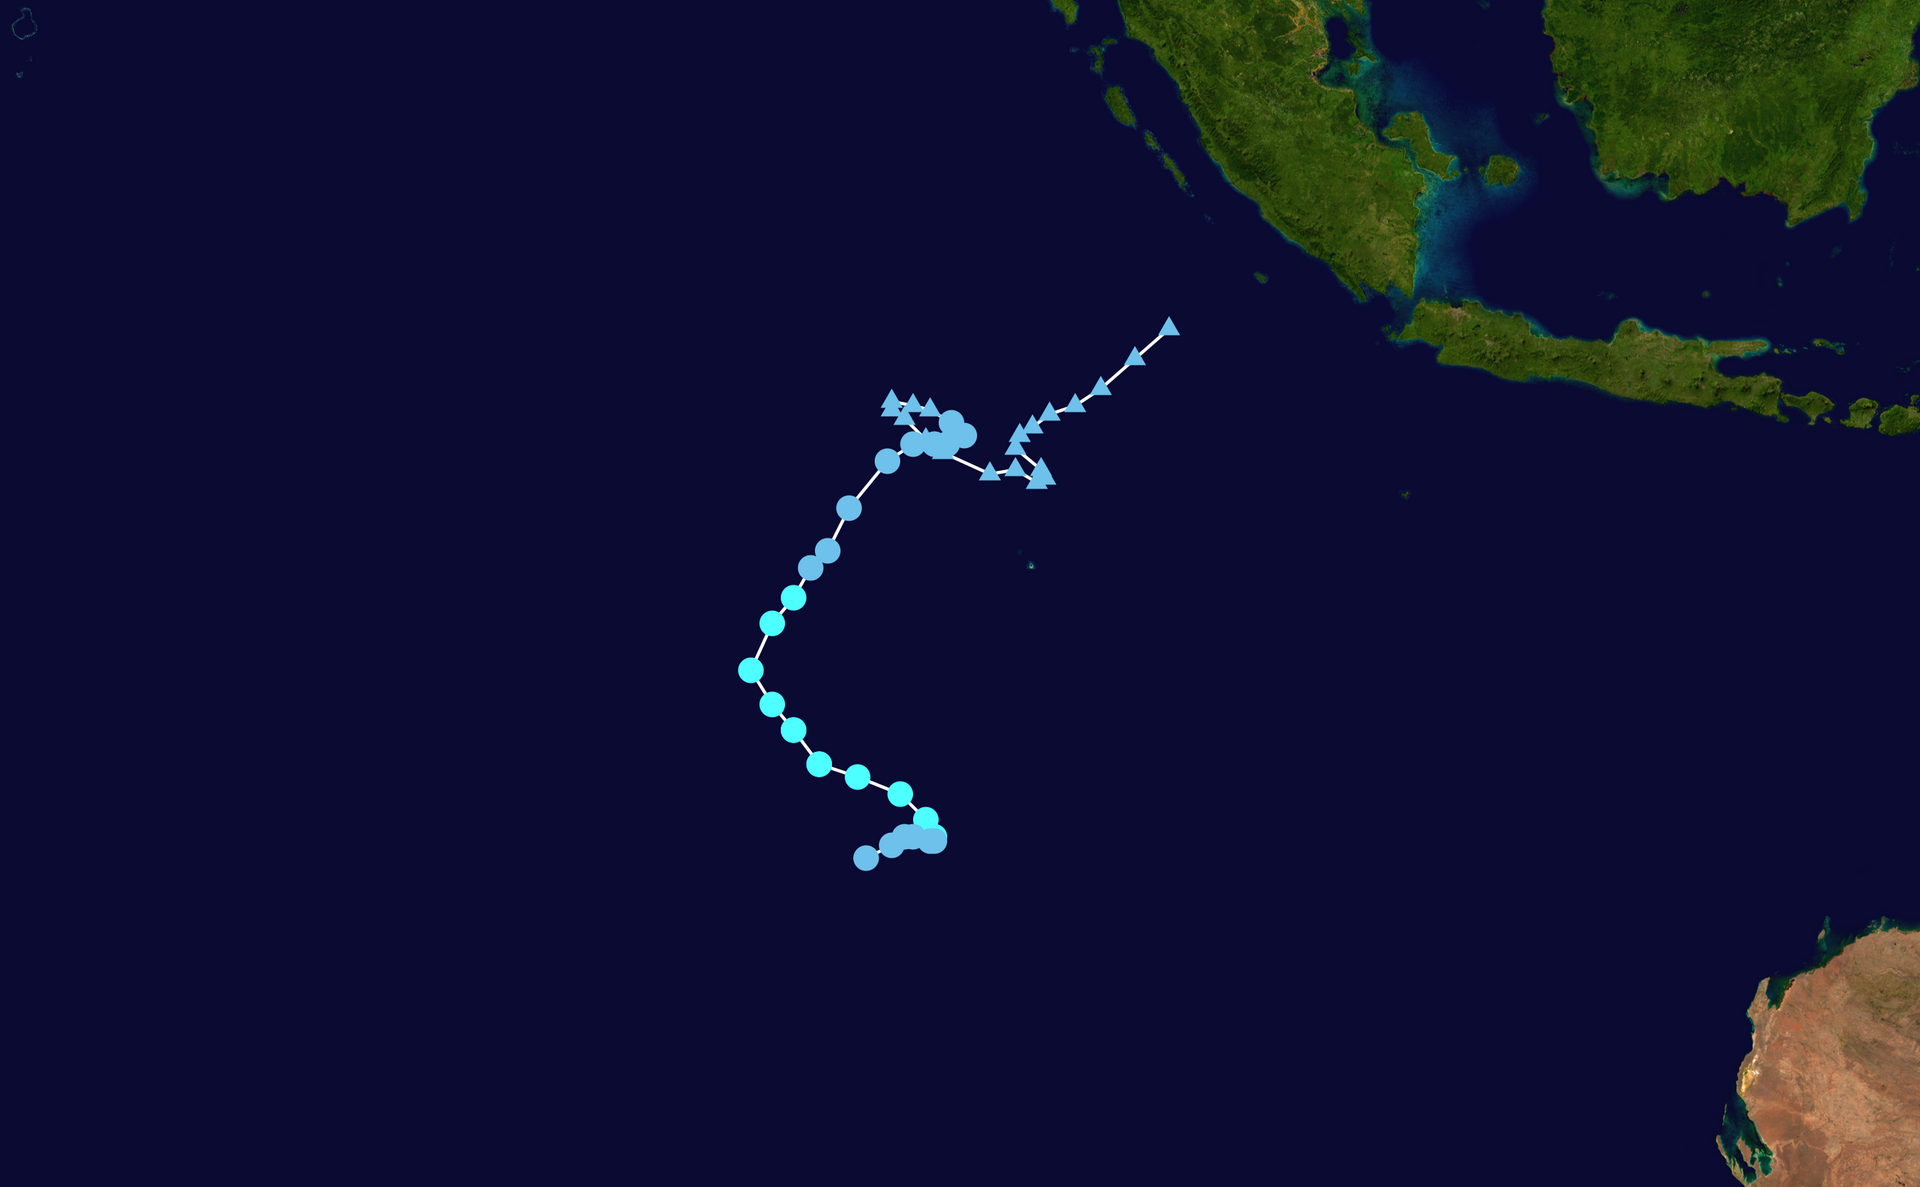
On 14 November, the Bureau of Meteorology noted that a tropical low could form west of Sumatra. Several days later, they noted that the tropical low was developing. Further consolidation due to a westerly wind burst, which also spawned a twin cyclone, prompted the Joint Typhoon Warning Center to first track it on 23 November. Despite deep convection being displaced due to moderate to high wind shear, the system’s circulation became increasingly defined, prompting the JTWC to issue a Tropical Cyclone formation Alert on the disturbance.
Robyn finally intensified into a Category 1 on 28 November and peaked with 100 km/h winds and 985 hpa on 29 November, and dissipated the next day due to wind shear.
Tropical Cyclone 09U
6 Jan – 12 Jan
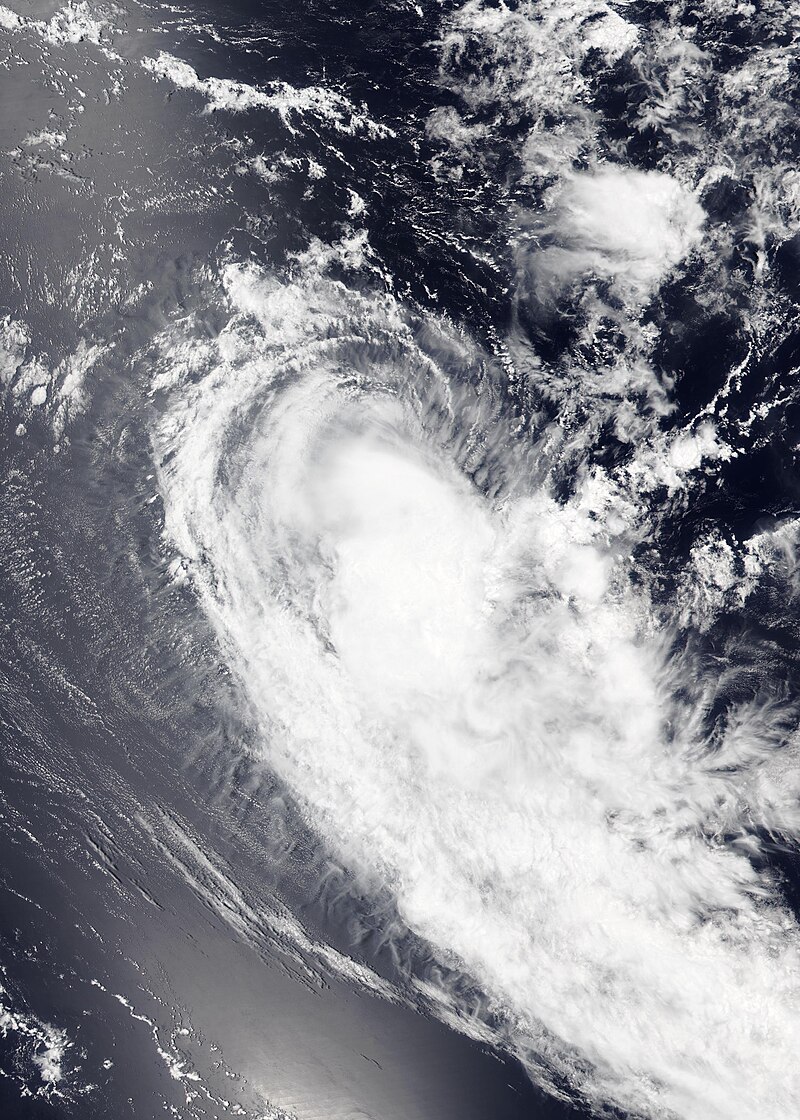
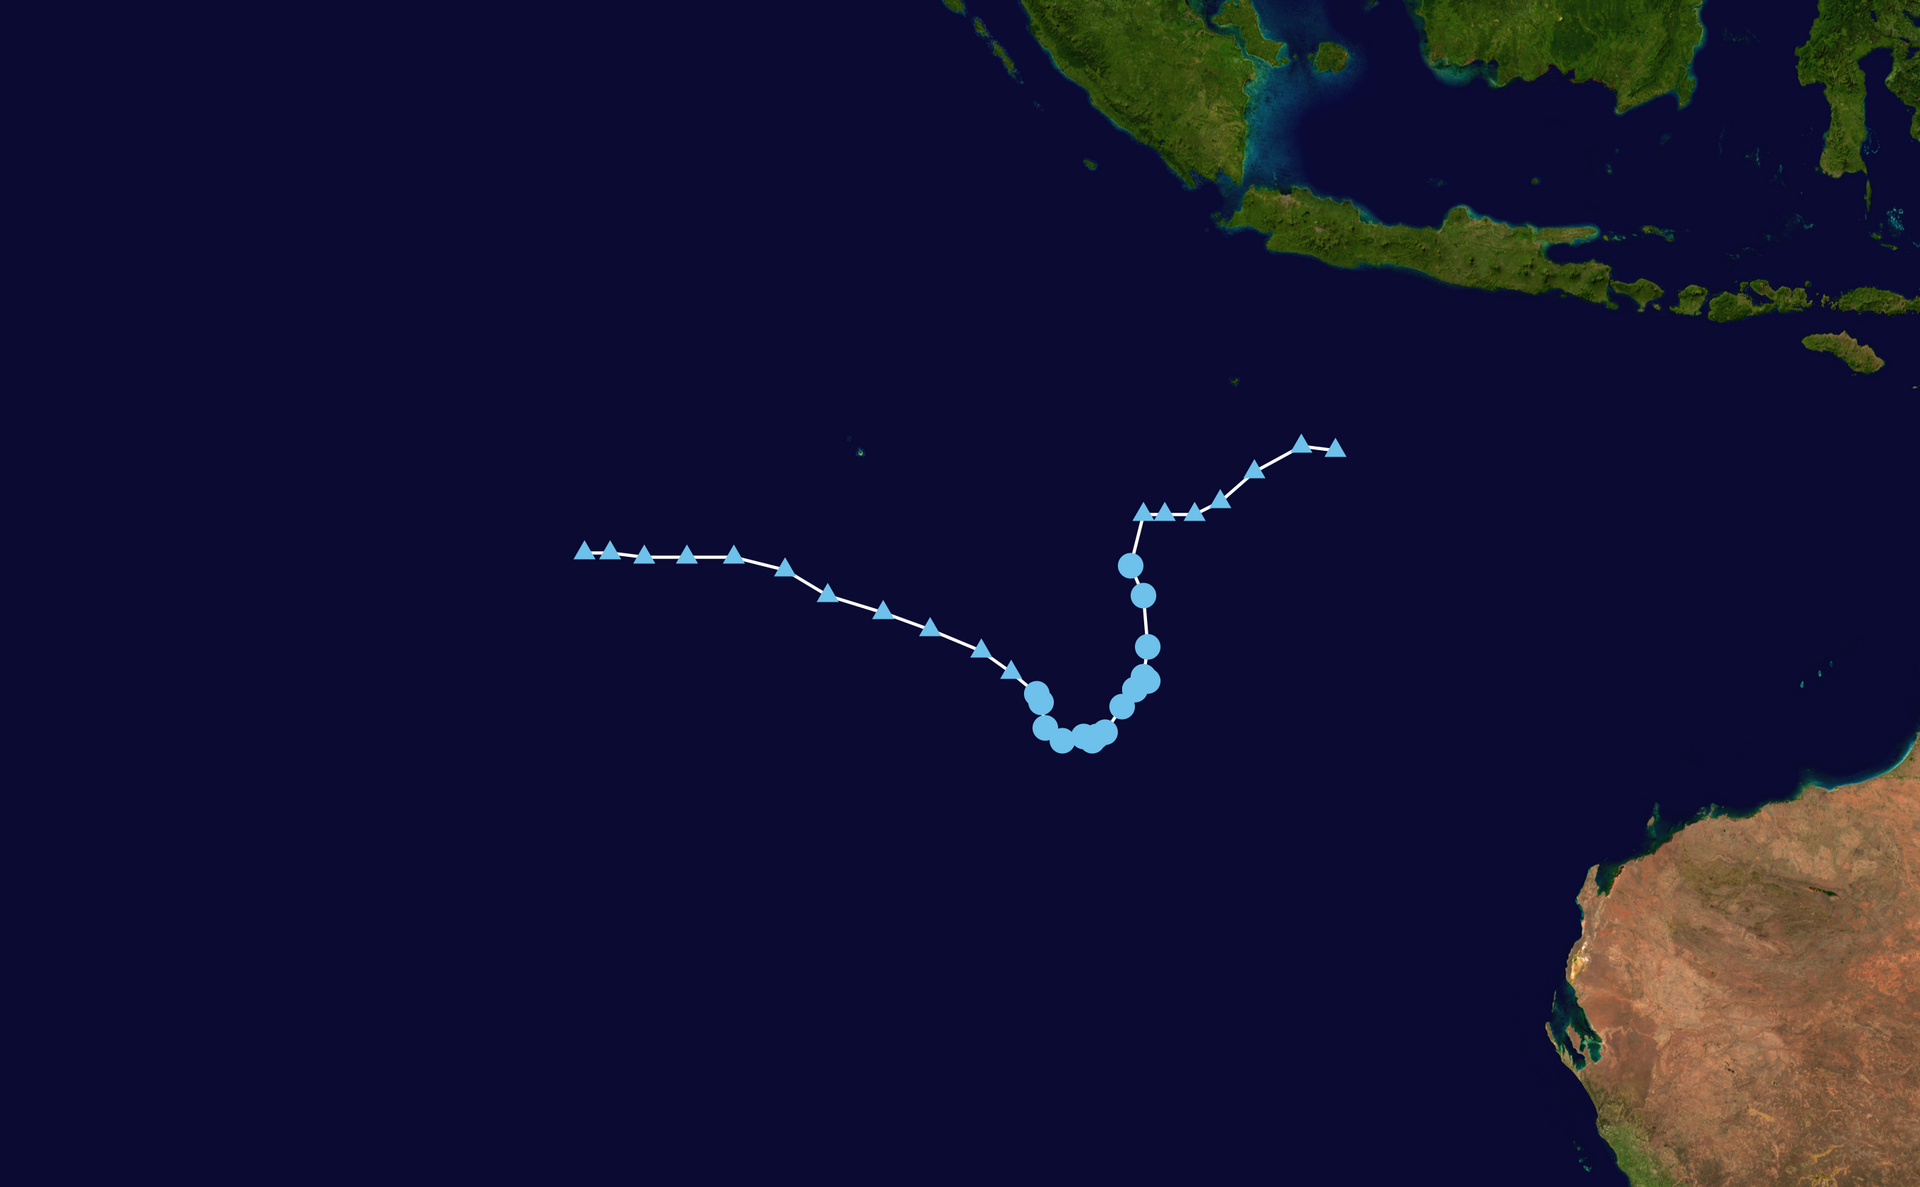
Tropical Low 09U Formed on 6 January and dissipated on 12 January. On 11 March 2025, the BOM announced 09U had been retroactively upgraded to Category 1 on the Australian scale.
Severe Tropical Cyclone Sean
17 Jan – 22 Jan
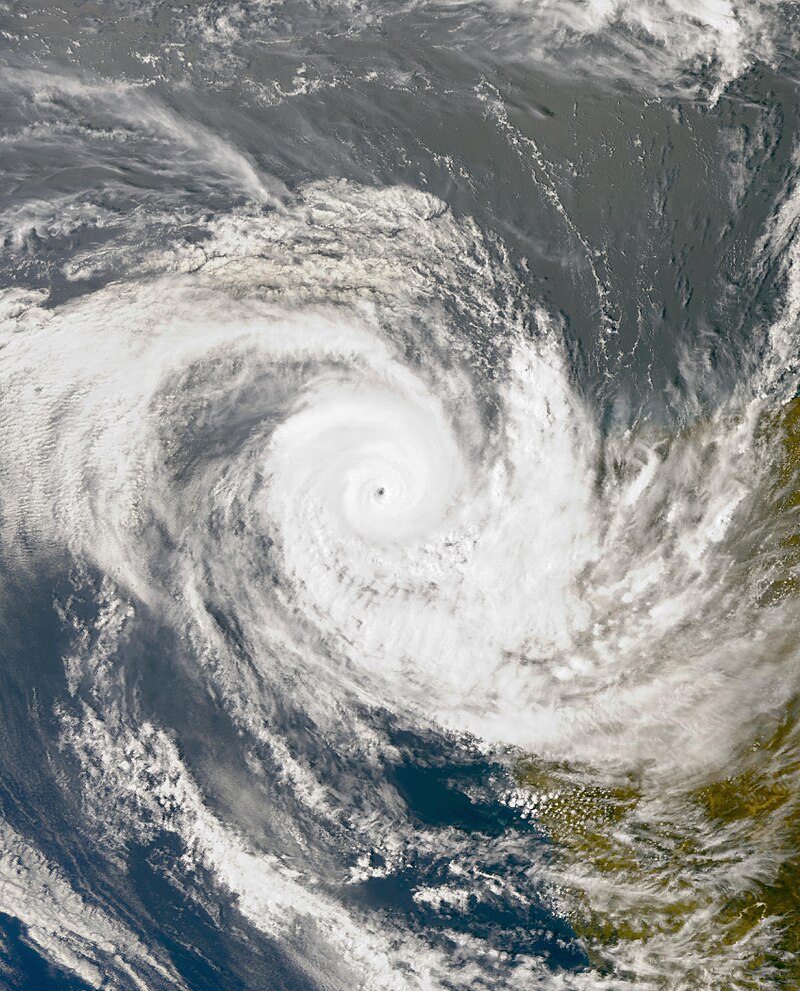
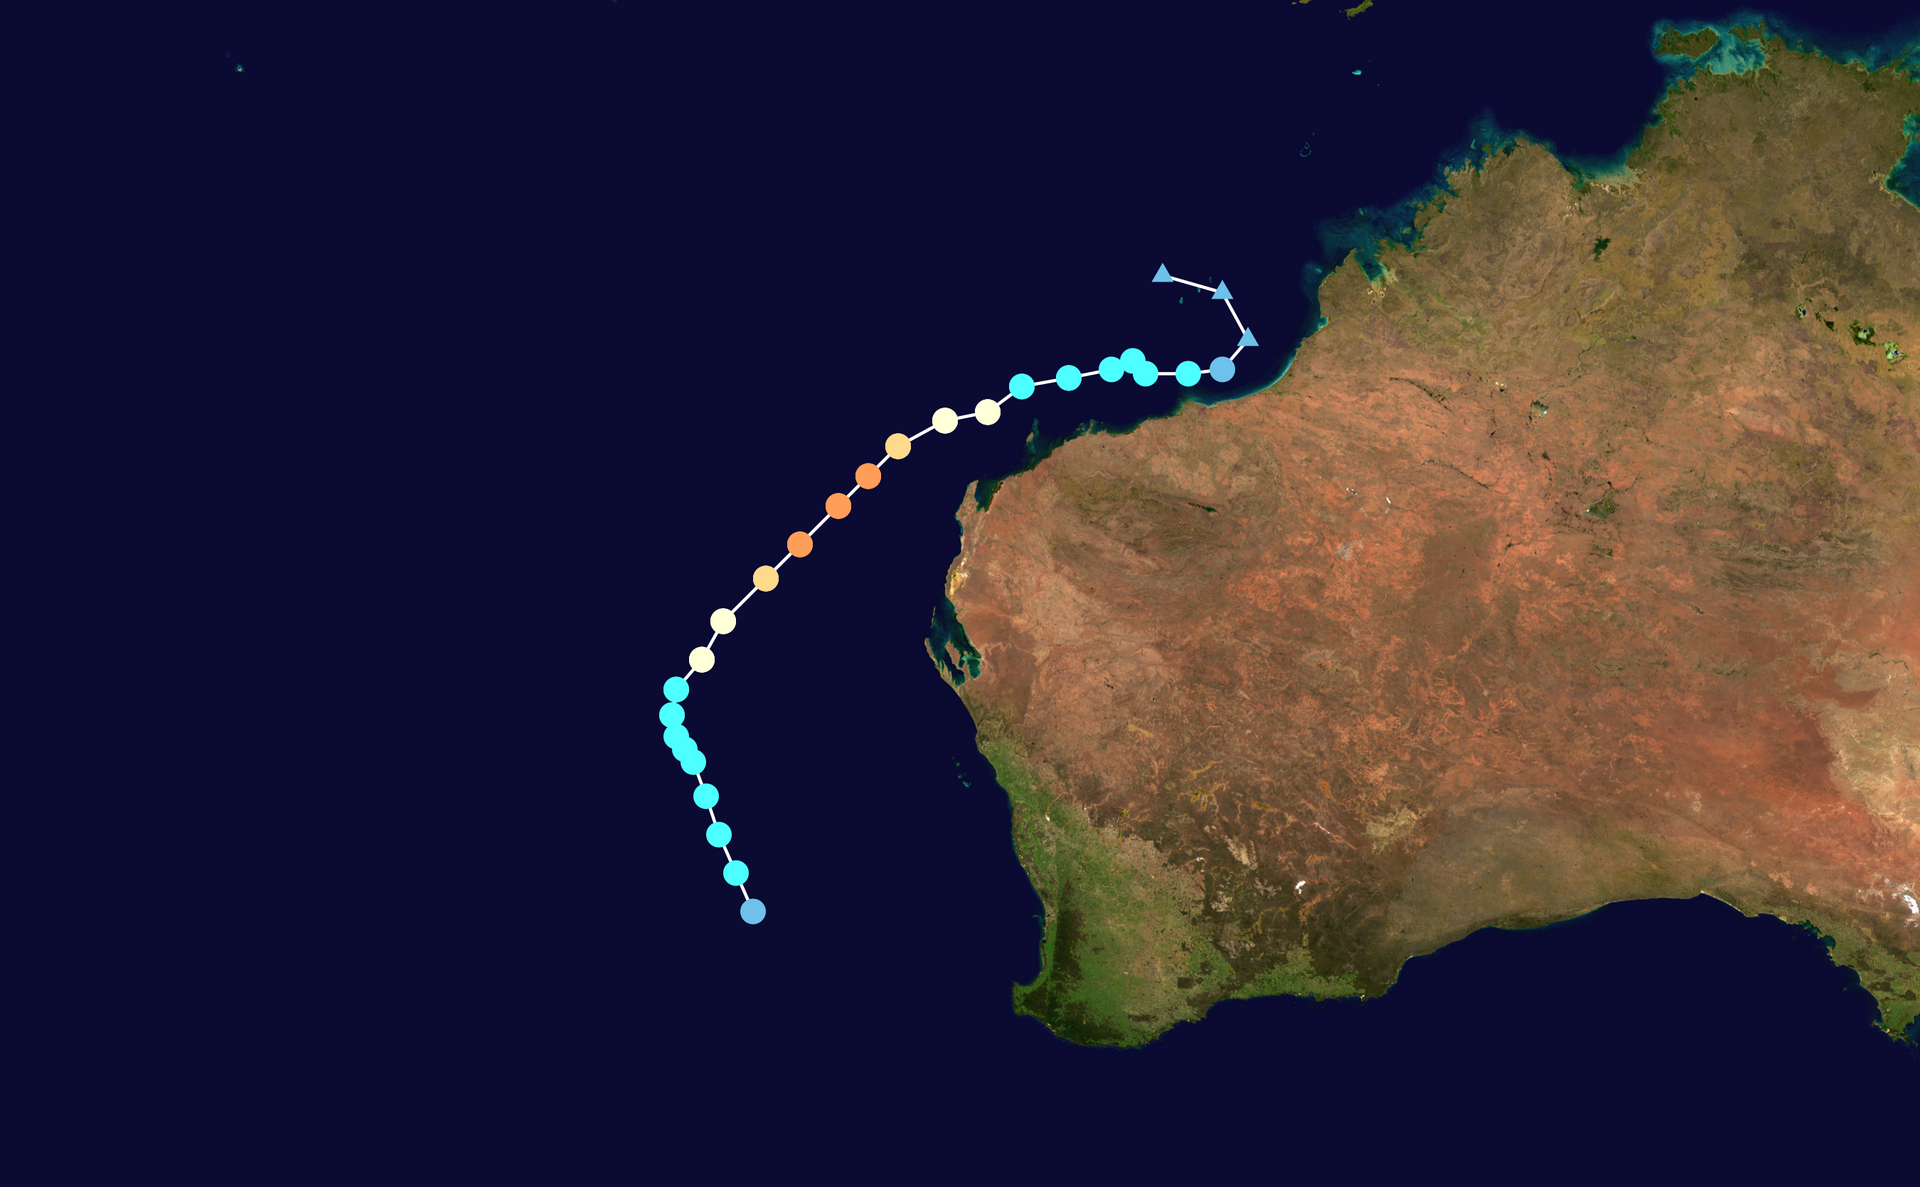
Tropical low 11U formed on 17 January, before moving westward, and absorbing TL 10U. On 19 January, it was identified by the Bureau of Meteorology to have reached Tropical Cyclone status, and was named Sean. The following day, Sean rapidly intensified, becoming a Category 3 Severe Tropical Cyclone on the Australian scale by 8am on January 20, and a Category 2 tropical cyclone on the Saffir-Simpson scale later the same day. During that day, Sean developed an eye, and by 16:00 AWST, the Bureau of Meteorology identified Sean to have reached 165 km/h 10 minute sustained winds, placing it at Category 4 status on the Australian cyclone scale. The peak 1 minute windspeed reached 110 kt, making it a Category 3 on the Saffir-Simpson scale. Sean started to weaken because of the decreasing sea surface temperatures and wind shear, and finally dissipated on 23 January.
Sean caused intense rainfall, storms, flash flooding and gale-force winds across large sections of the Pilbara, and Gascoyne regions of Western Australia, including Onslow, and Exmouth. Cyclone Sean caused a record amount of rain to fall in Karratha, with 274.4 mm recorded in the 24 hours until 9:00 AM local time on January 20. Roads and homes were inundated, power grids were damaged, and ports were closed.
Severe Tropical Cyclone Taliah
31 Jan – 12 Feb
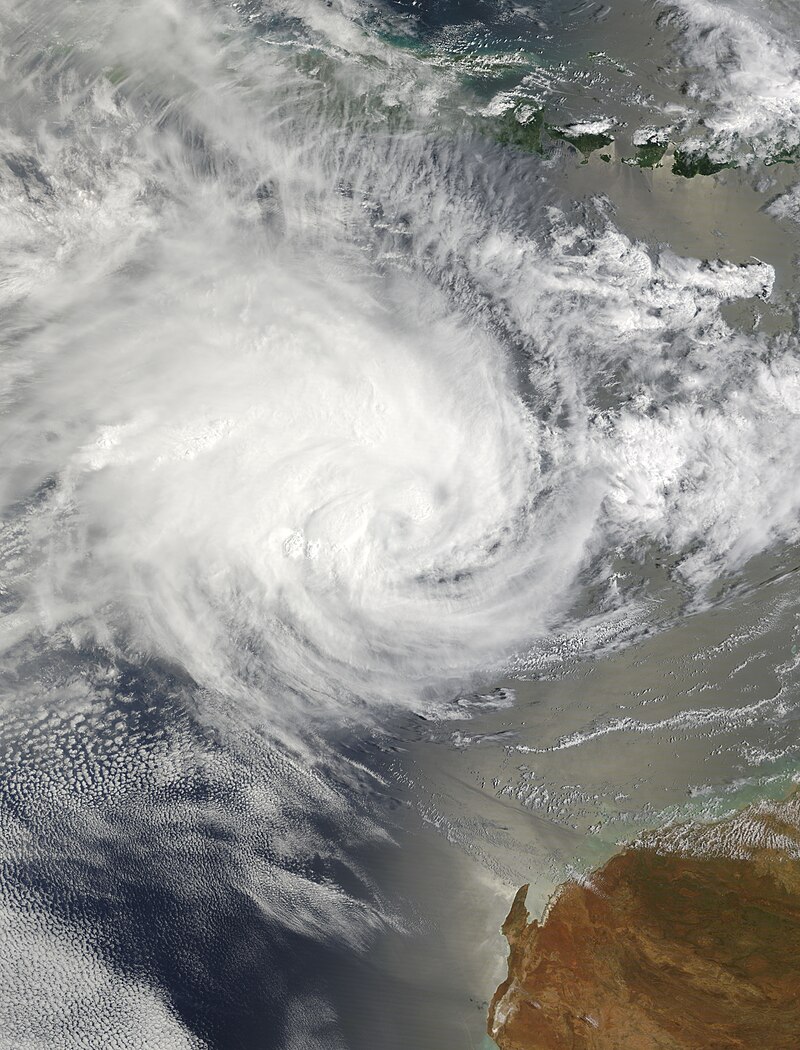
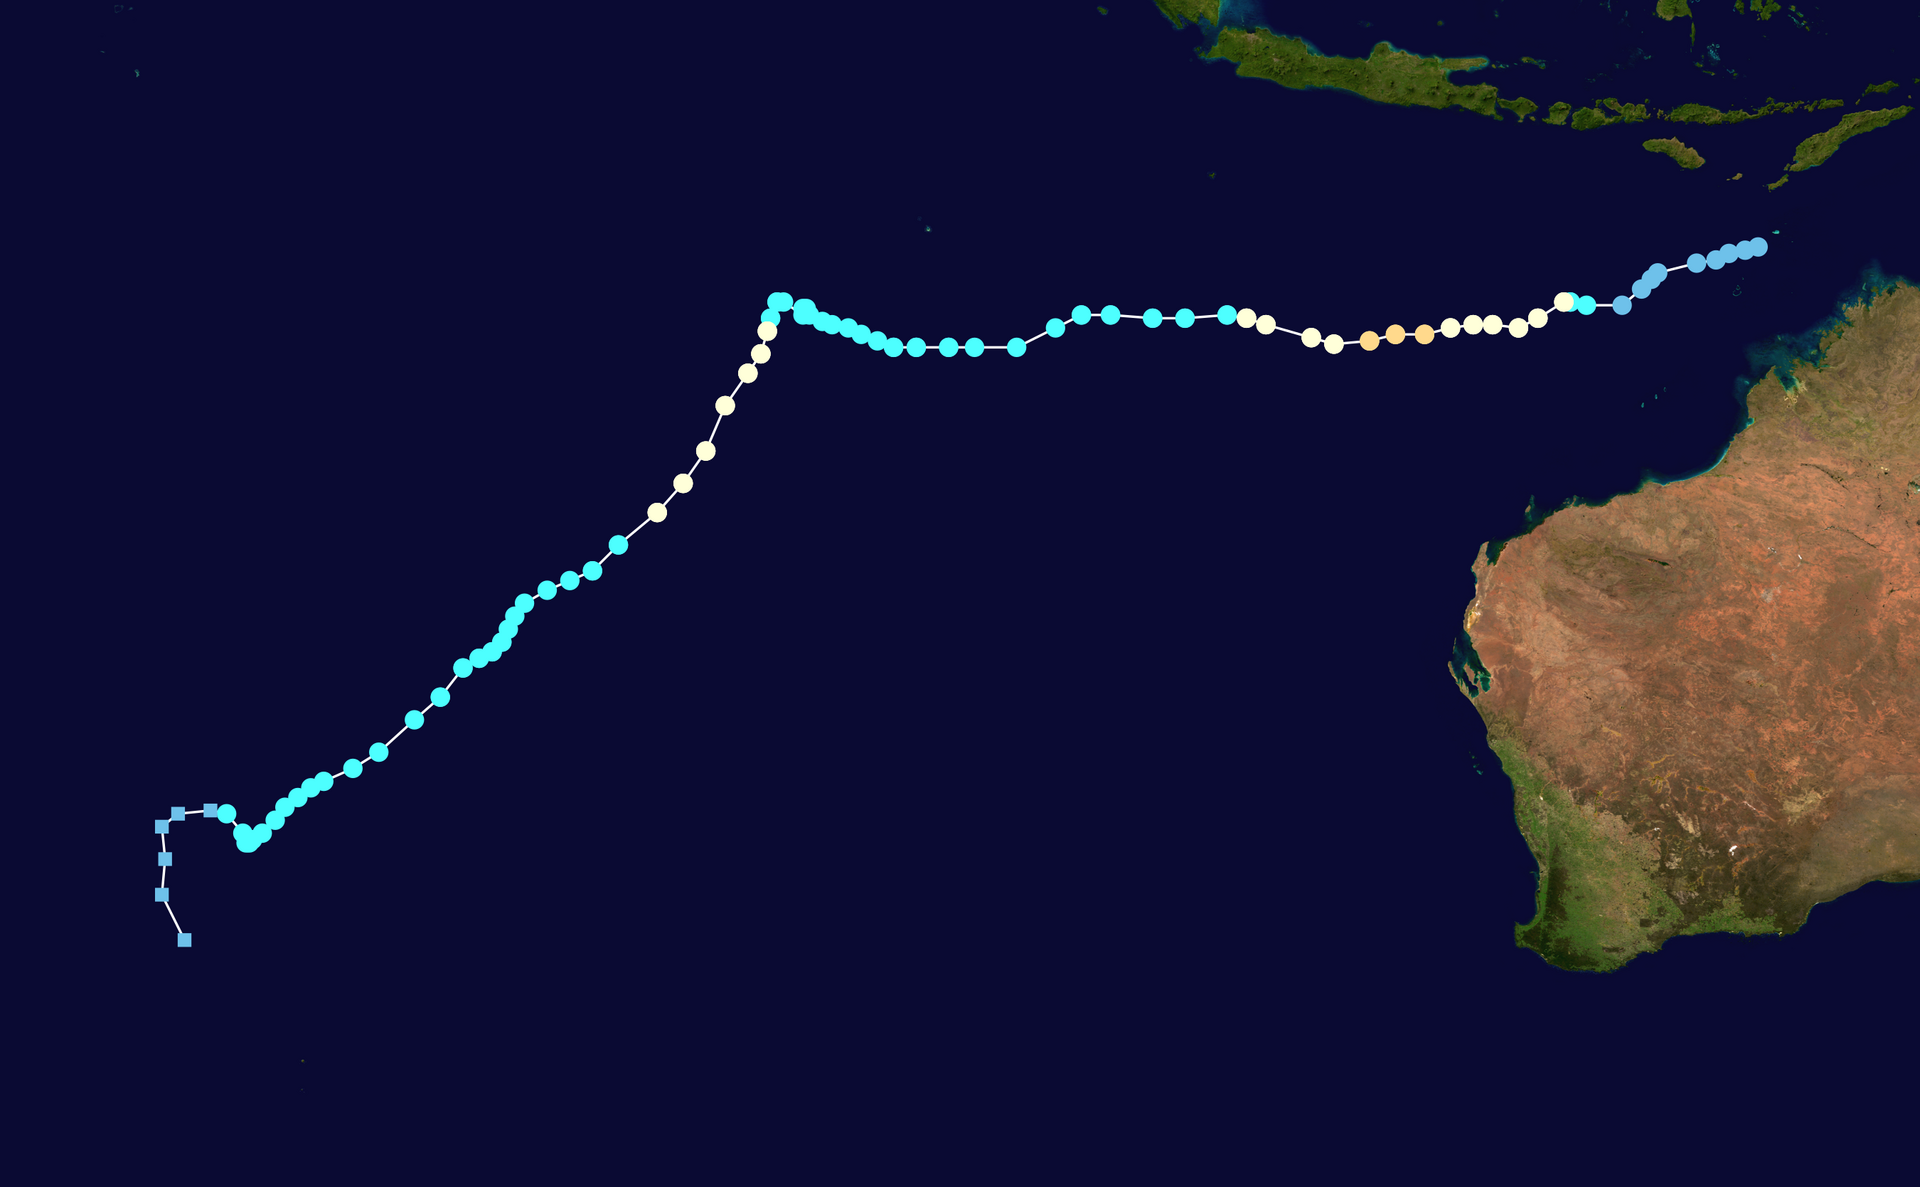
Tropical Low 14U formed south of Timor-Leste on 31 January. On 1 February, the Bureau of Meteorology noted that the system had a high 65% chance to develop into a tropical cyclone by Sunday, and an 85% chance of forming before Monday. Later that day, 14U was upgraded to tropical cyclone status and assigned the name Taliah by the BoM. Over the next few days, the system slowly strengthened before being upgraded to a severe tropical cyclone on 3 February. On 12 February, the system moved into the South-western Indian Ocean out of BoM area of responsibility.
Severe Tropical Cyclone Vince
31 Jan – 4 Feb
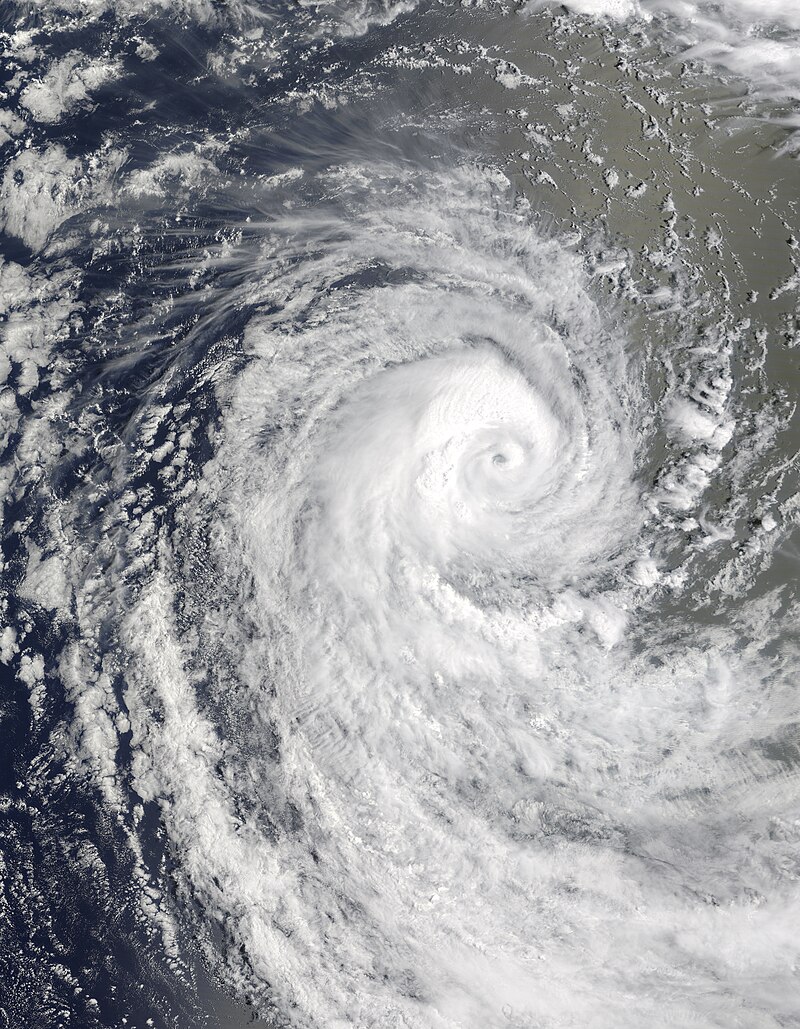
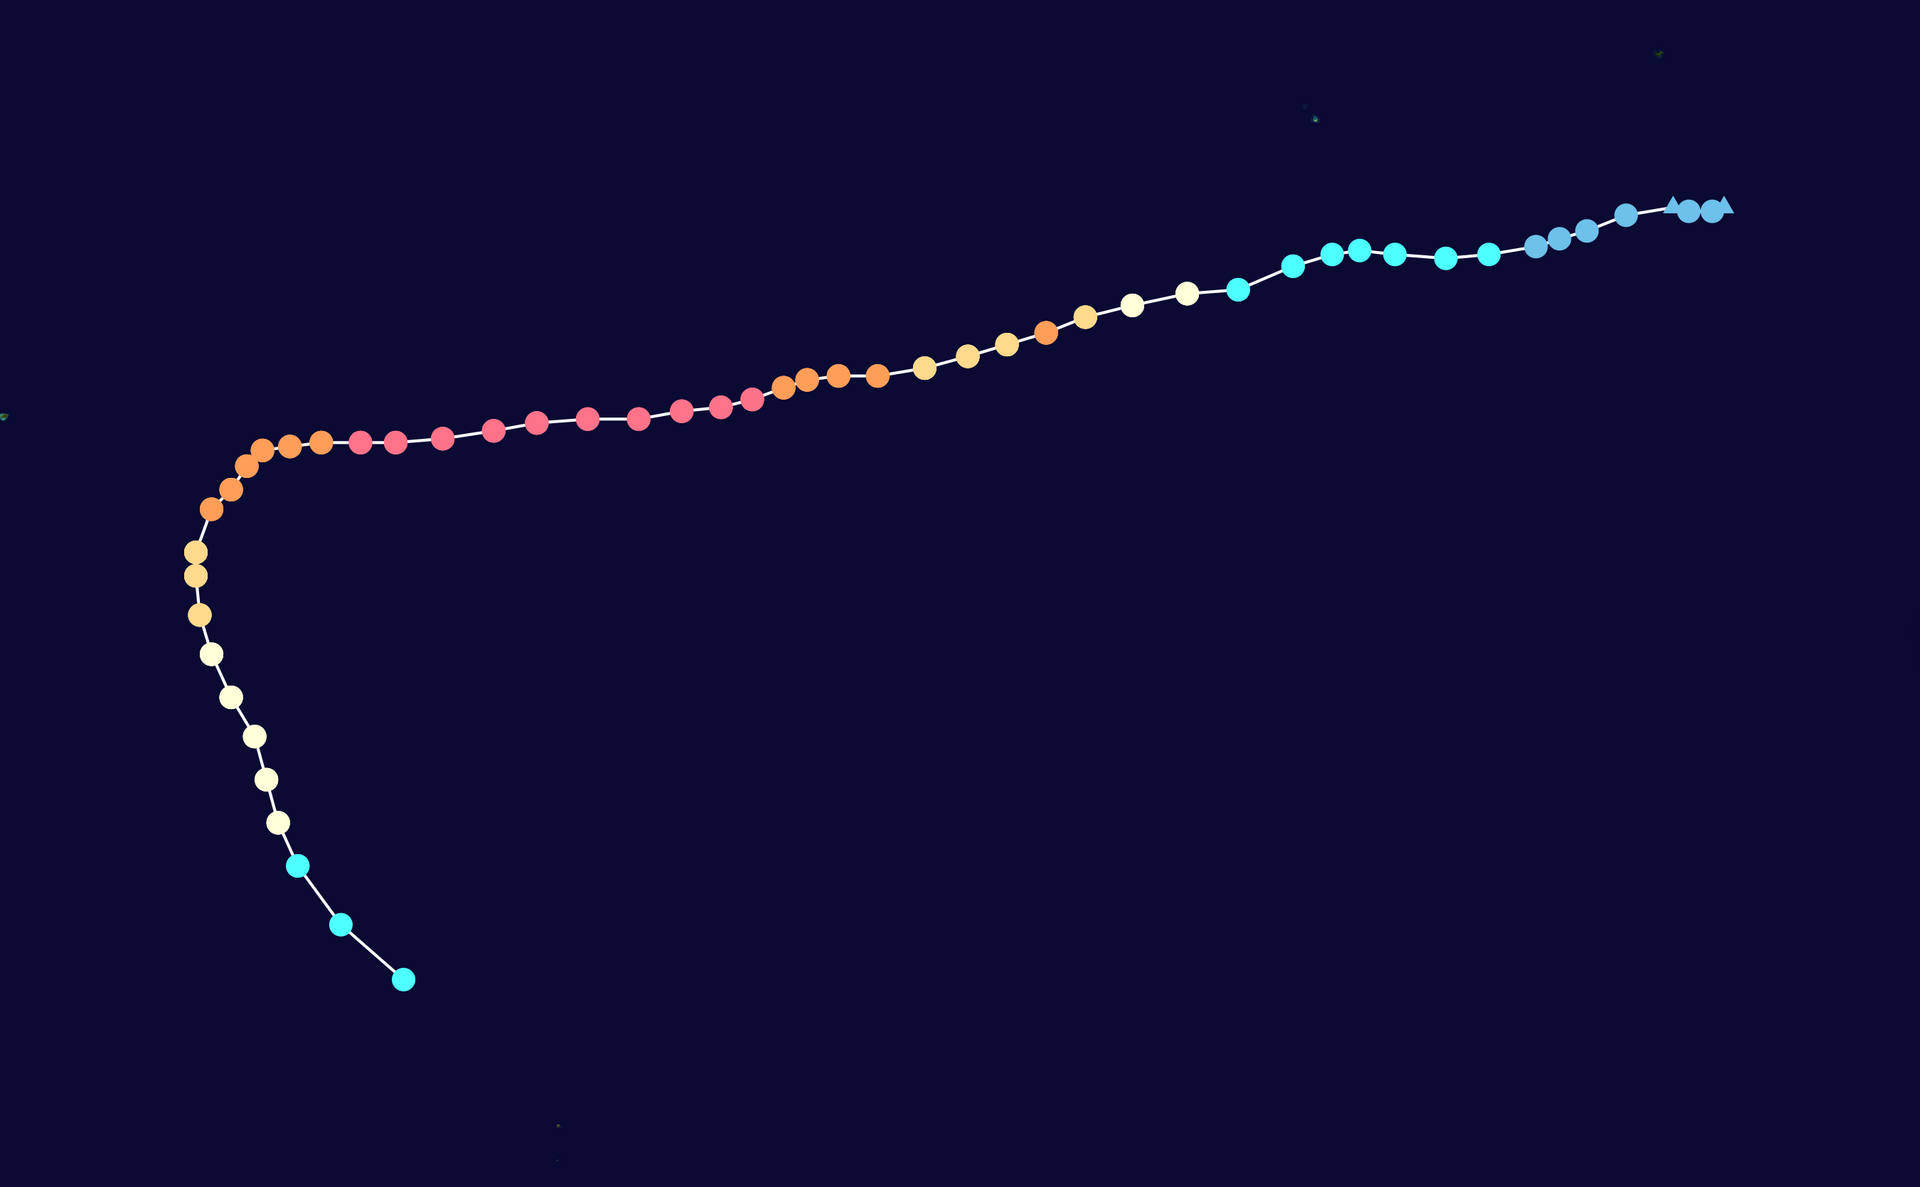
Tropical Low 15U formed south of Christmas Island on 1 February, then on 2 February it got named Vince. The system strengthened until it reached Category 3 (Australian Scale). The cyclone exited the Bureau of Meteorology area of responsibility on 4 February
Severe Tropical Cyclone Zelia
7 Feb – 15 Feb
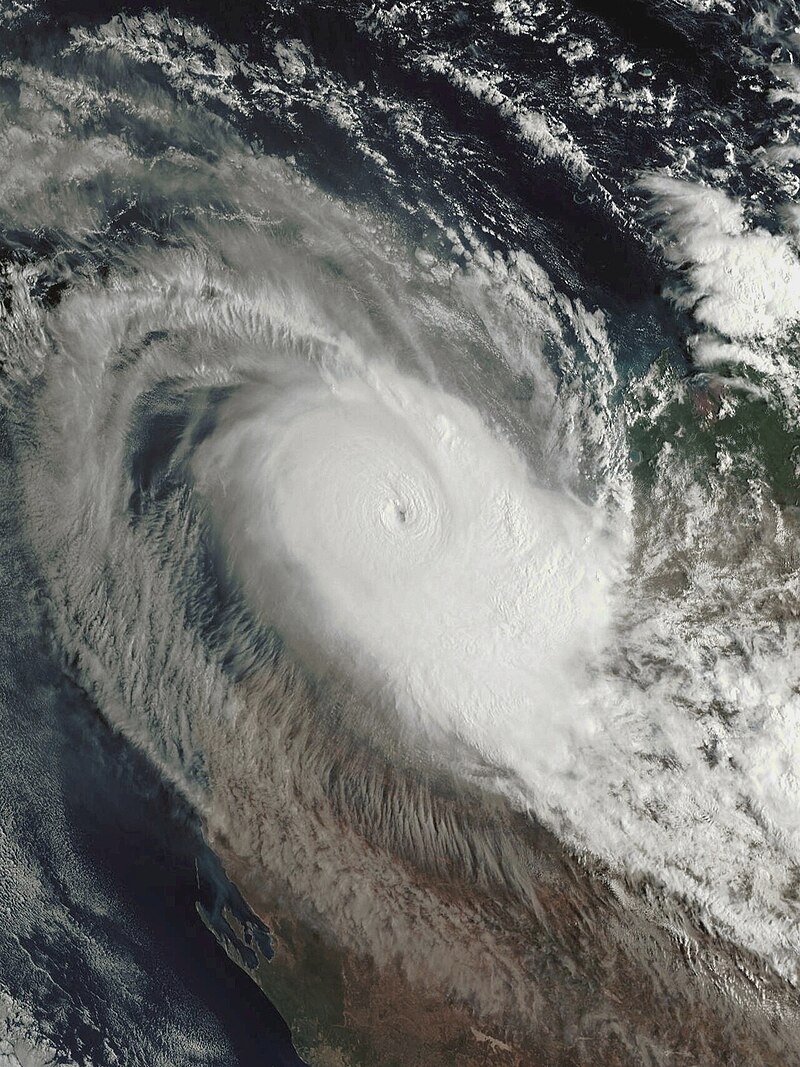
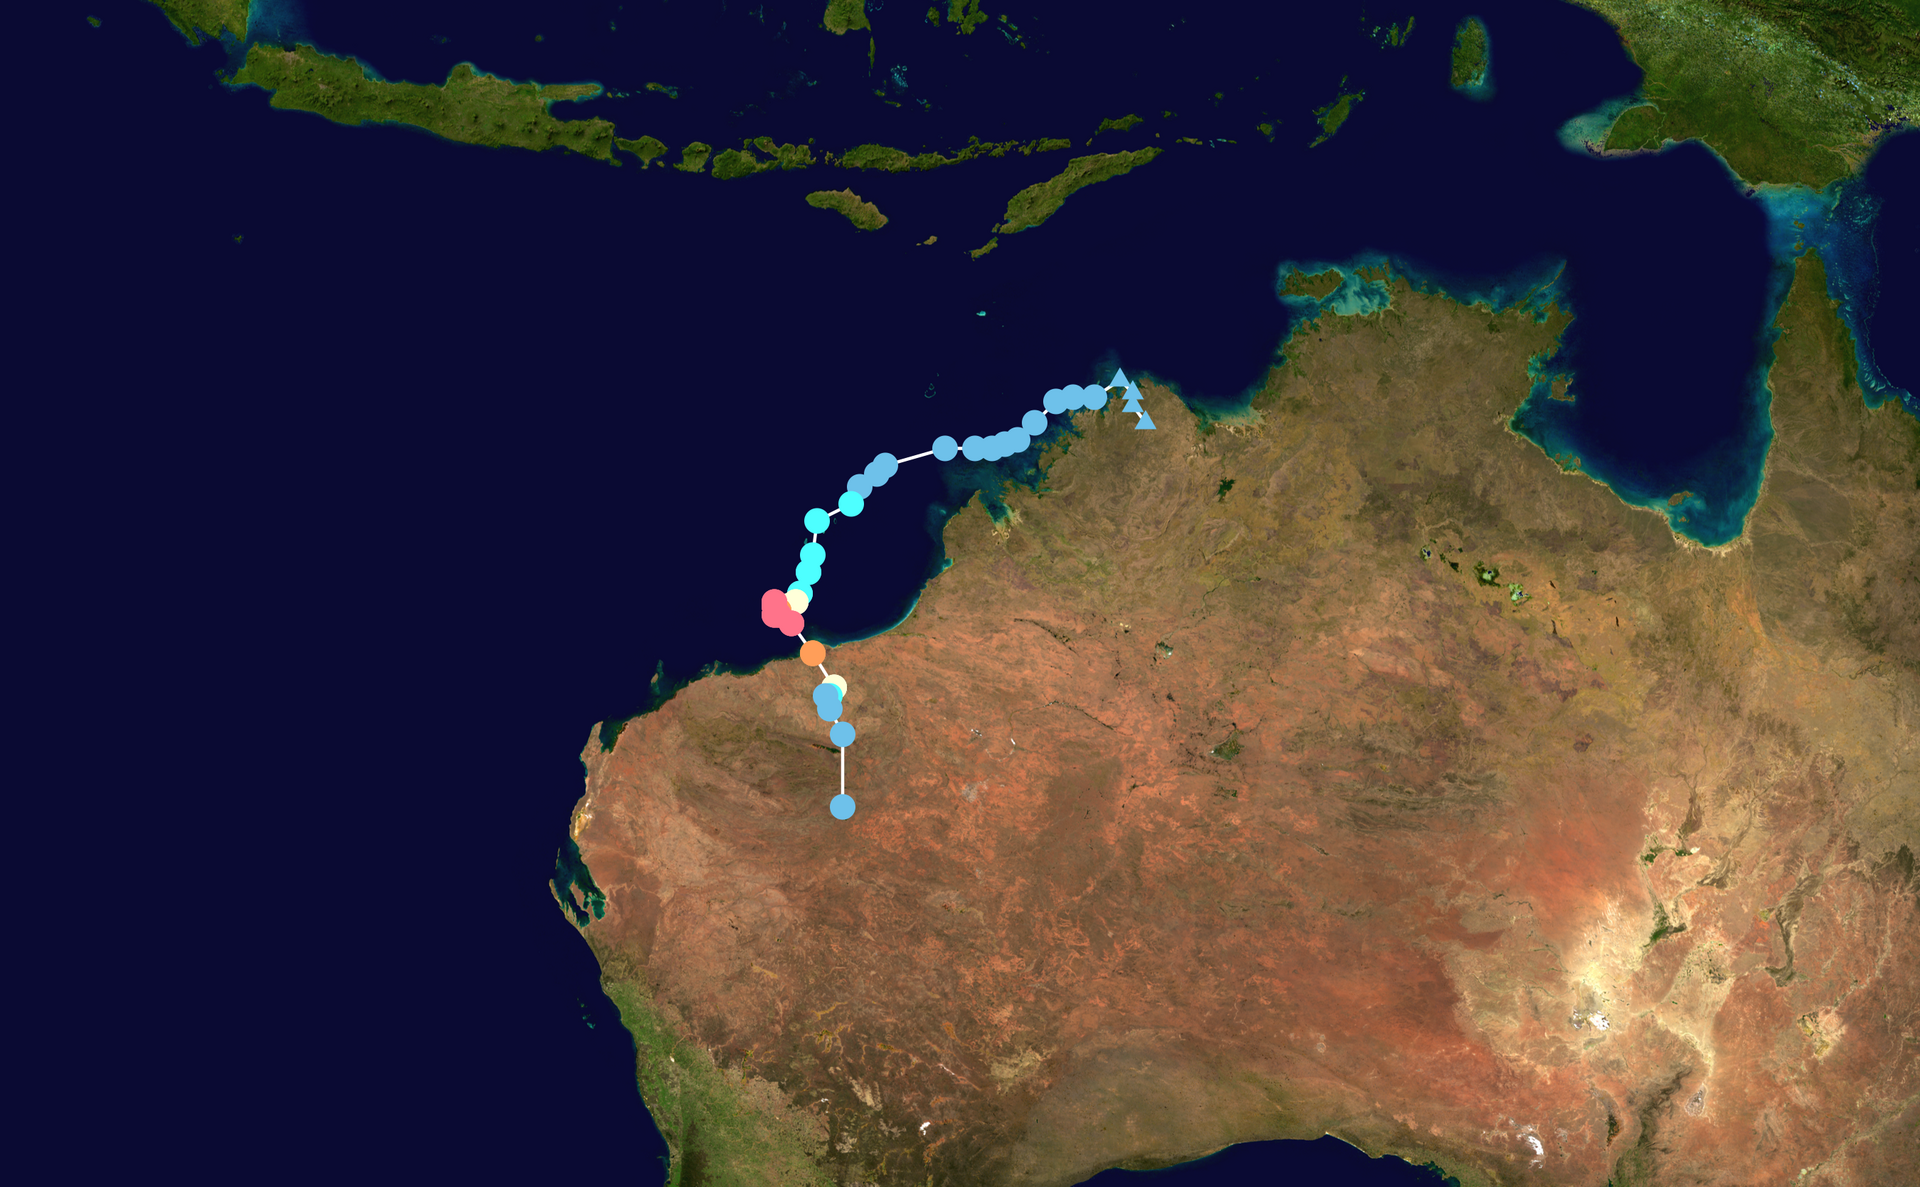
Tropical Low 18U formed on 7 February. It began tracking west-southwest, and was upgraded to a Category 1 system, named Zelia on 11 February. The storm then steadily intensified to become a Category 2 by the next morning. That night, the storm slowed, and began rapid Intensification, to reach Category 4 status by 06:00 AWST on 13 February, and Category 5 status by 12:00 AWST that day. The storm then stalled and began an eyewall replacement cycle as shown by radar imagery, causing the rapid intensification phase to end. Increasing wind shear and the eyewall replacement cycle caused Zelia to peak with 10-minute sustained winds of 205 km/h (125 mph); a Category 5 on the Australian scale. On 14 February, Severe Tropical Cyclone Zelia made landfall at around 12:30 AWST in the afternoon near the De Grey River mouth, northeast of Port Hedland at Category 4 intensity. Zelia quickly weakened after landfall, and it dropped below tropical cyclone intensity later that day.
Severe Tropical Cyclone Alfred
20 Feb – 9 March
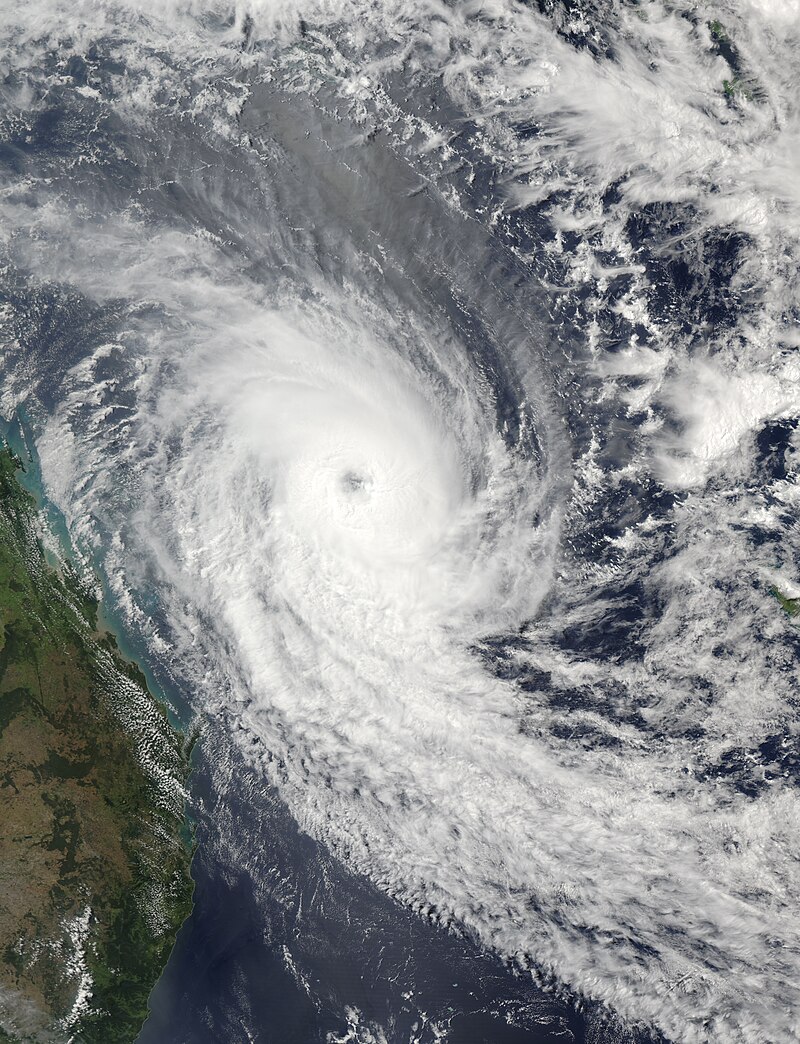
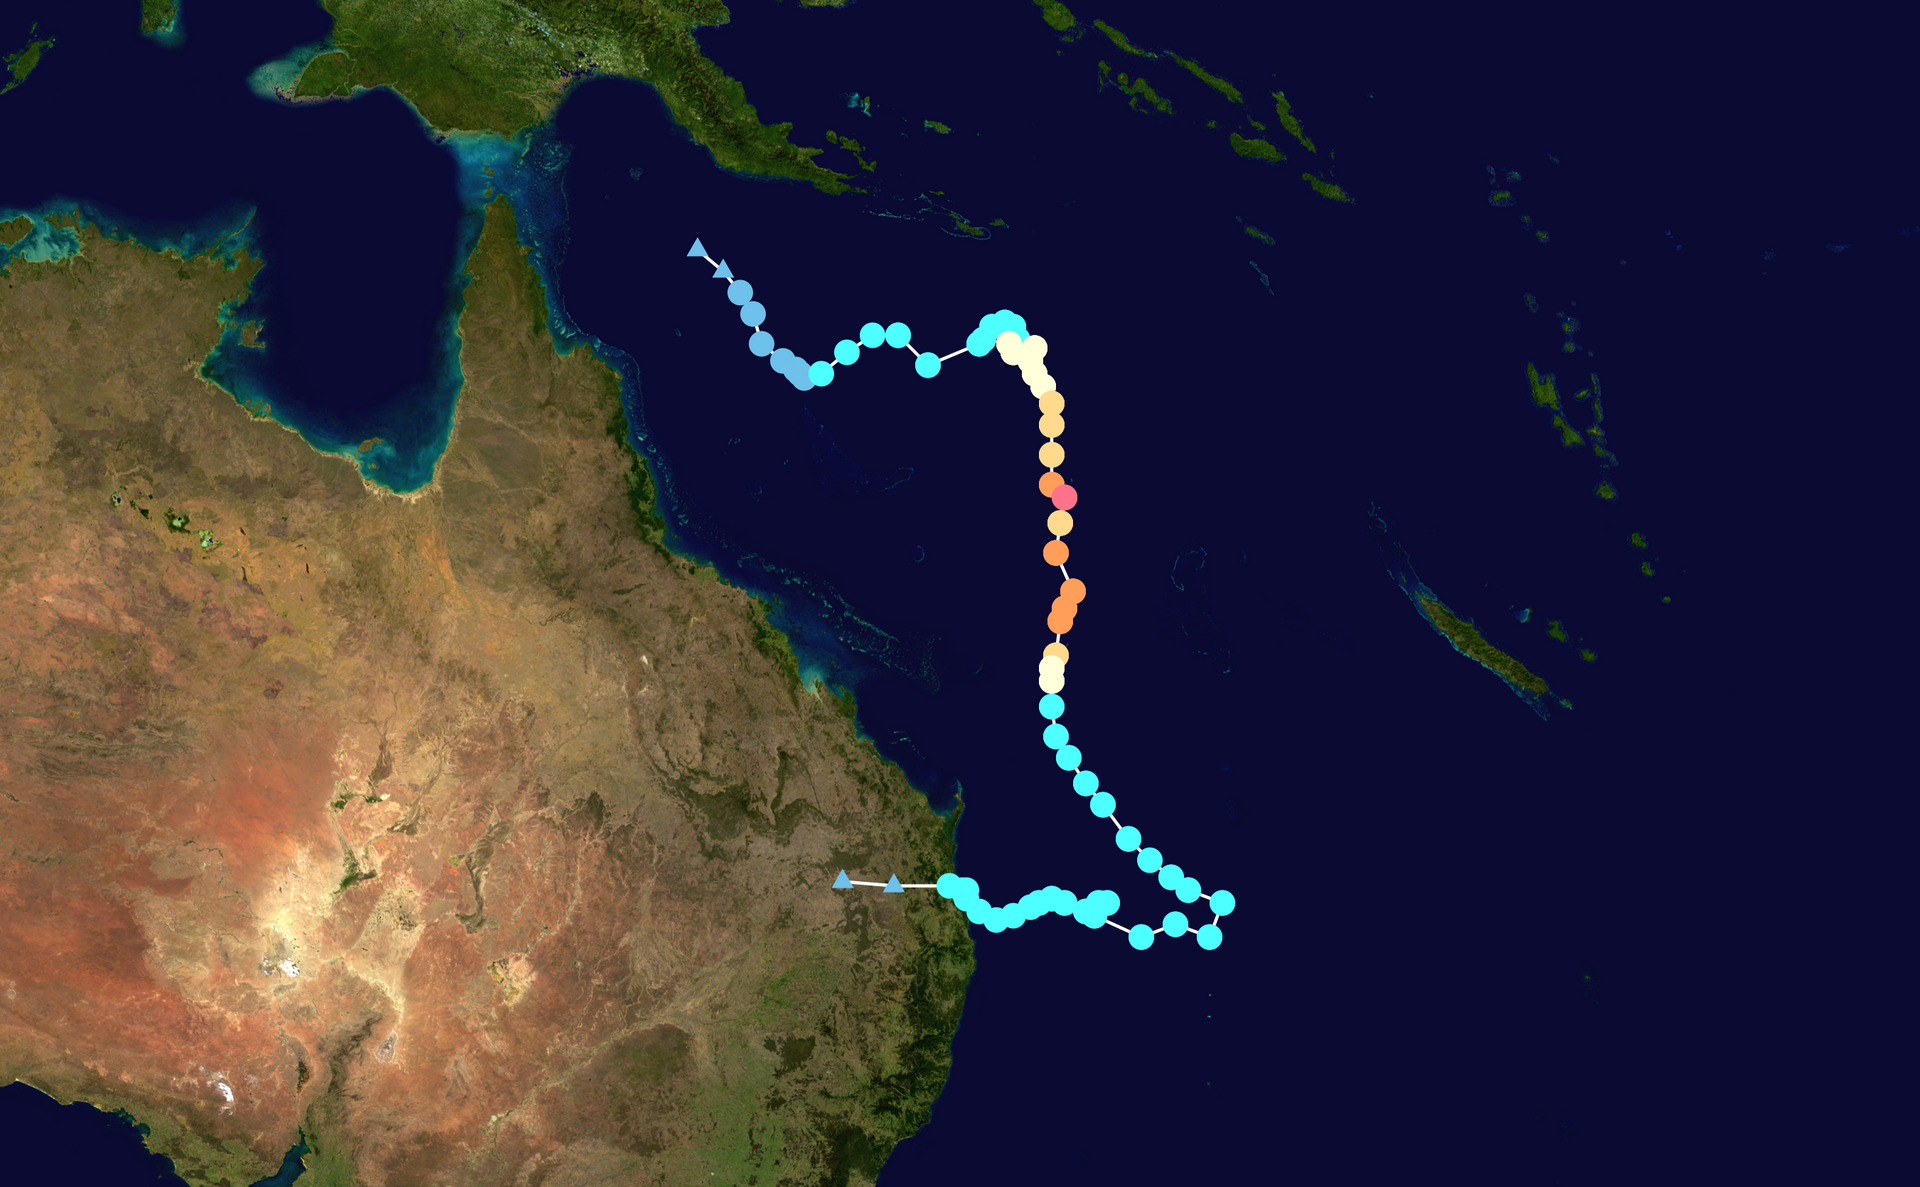
On 20 February, a tropical low was spotted by the BOM in the Coral Sea. The disturbance, initially designated by the agency as 22U, was noted to likely develop into a tropical cyclone over the next several days. Two days later, the JTWC – which unofficially monitors all tropical cyclone basins, including the Australian region – upgraded the system to a tropical storm on the Saffir-Simpson Scale (SSHWS). Initially, the BOM did not immediately follow suit and kept it as a tropical low; however, around 16:20 AEST, BOM upgraded the system to a category 1, with the name Alfred being assigned to it. Over the next couple of days, the storm continued to gradually move to the east, and was upgraded to a category 2 tropical cyclone in the Australian scale at 16:00 AEST on 24 February. As Alfred then turned south, it also continued to intensify, attaining category 3 status on 26 February at 22:00 AEST. The next day, the BOM further upgraded Alfred to a category 4 cyclone as a small eye appeared on visible satellite imagery. Later that night, an eyewall replacement cycle (ERC) occurred, prompting Alfred to fluctuate between Categories 3 and 4 on 1 March, before further weakening down to a Category 1 the following day. The cyclone then re-strengthened slightly to category 2 status by 3 March, before being downgraded to a Category 1 on 8 March.
Beginning on 3 March, watches and warnings were issued in SEQ – including Brisbane – as Alfred posed a notable risk to the area, with all major forecast models having predicted an SEQ landfall between 6 and 8 March. A Cyclone Watch was issued between Sandy Cape, and Grafton, including Brisbane – the first for the city since a watch was briefly issued for TC Oma in 2019. The northeastern part of NSW is also expected to be under a cyclone warning in preparation for the storm. Alfred made landfall at Moreton Island on 01:00 AEST March 8 as a category 1 tropical cyclone, and was downgraded to a tropical low at 06:00 the same day.
Severe Tropical Bianca
18 Feb – 27 Feb
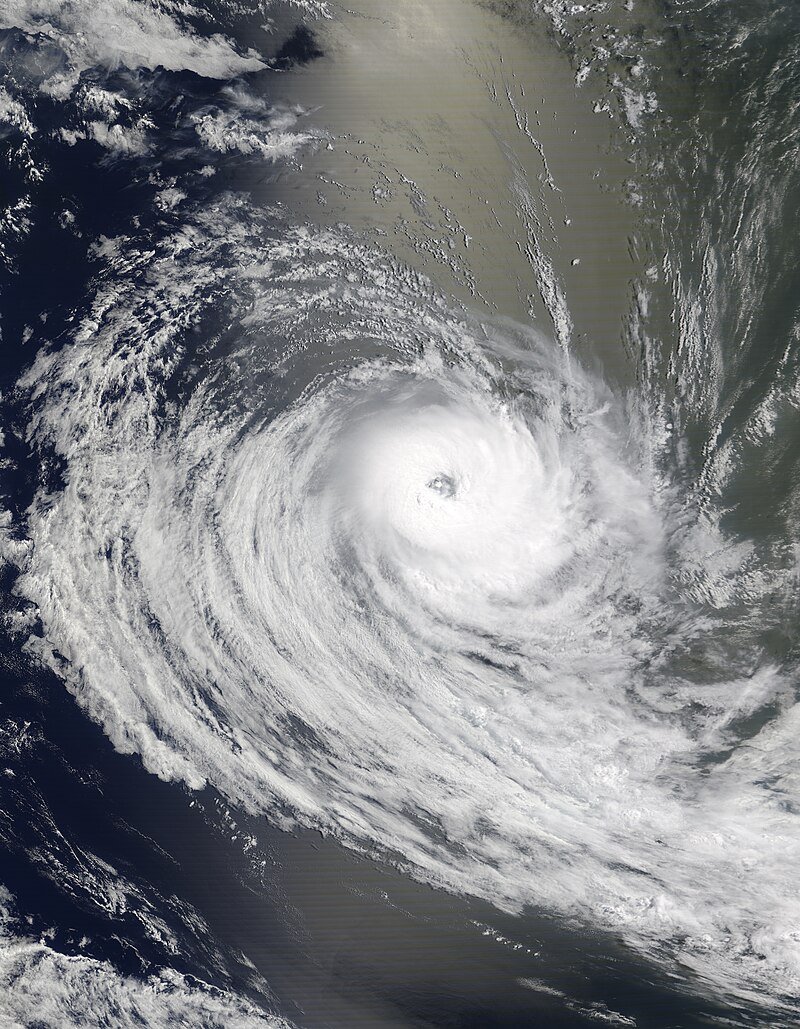
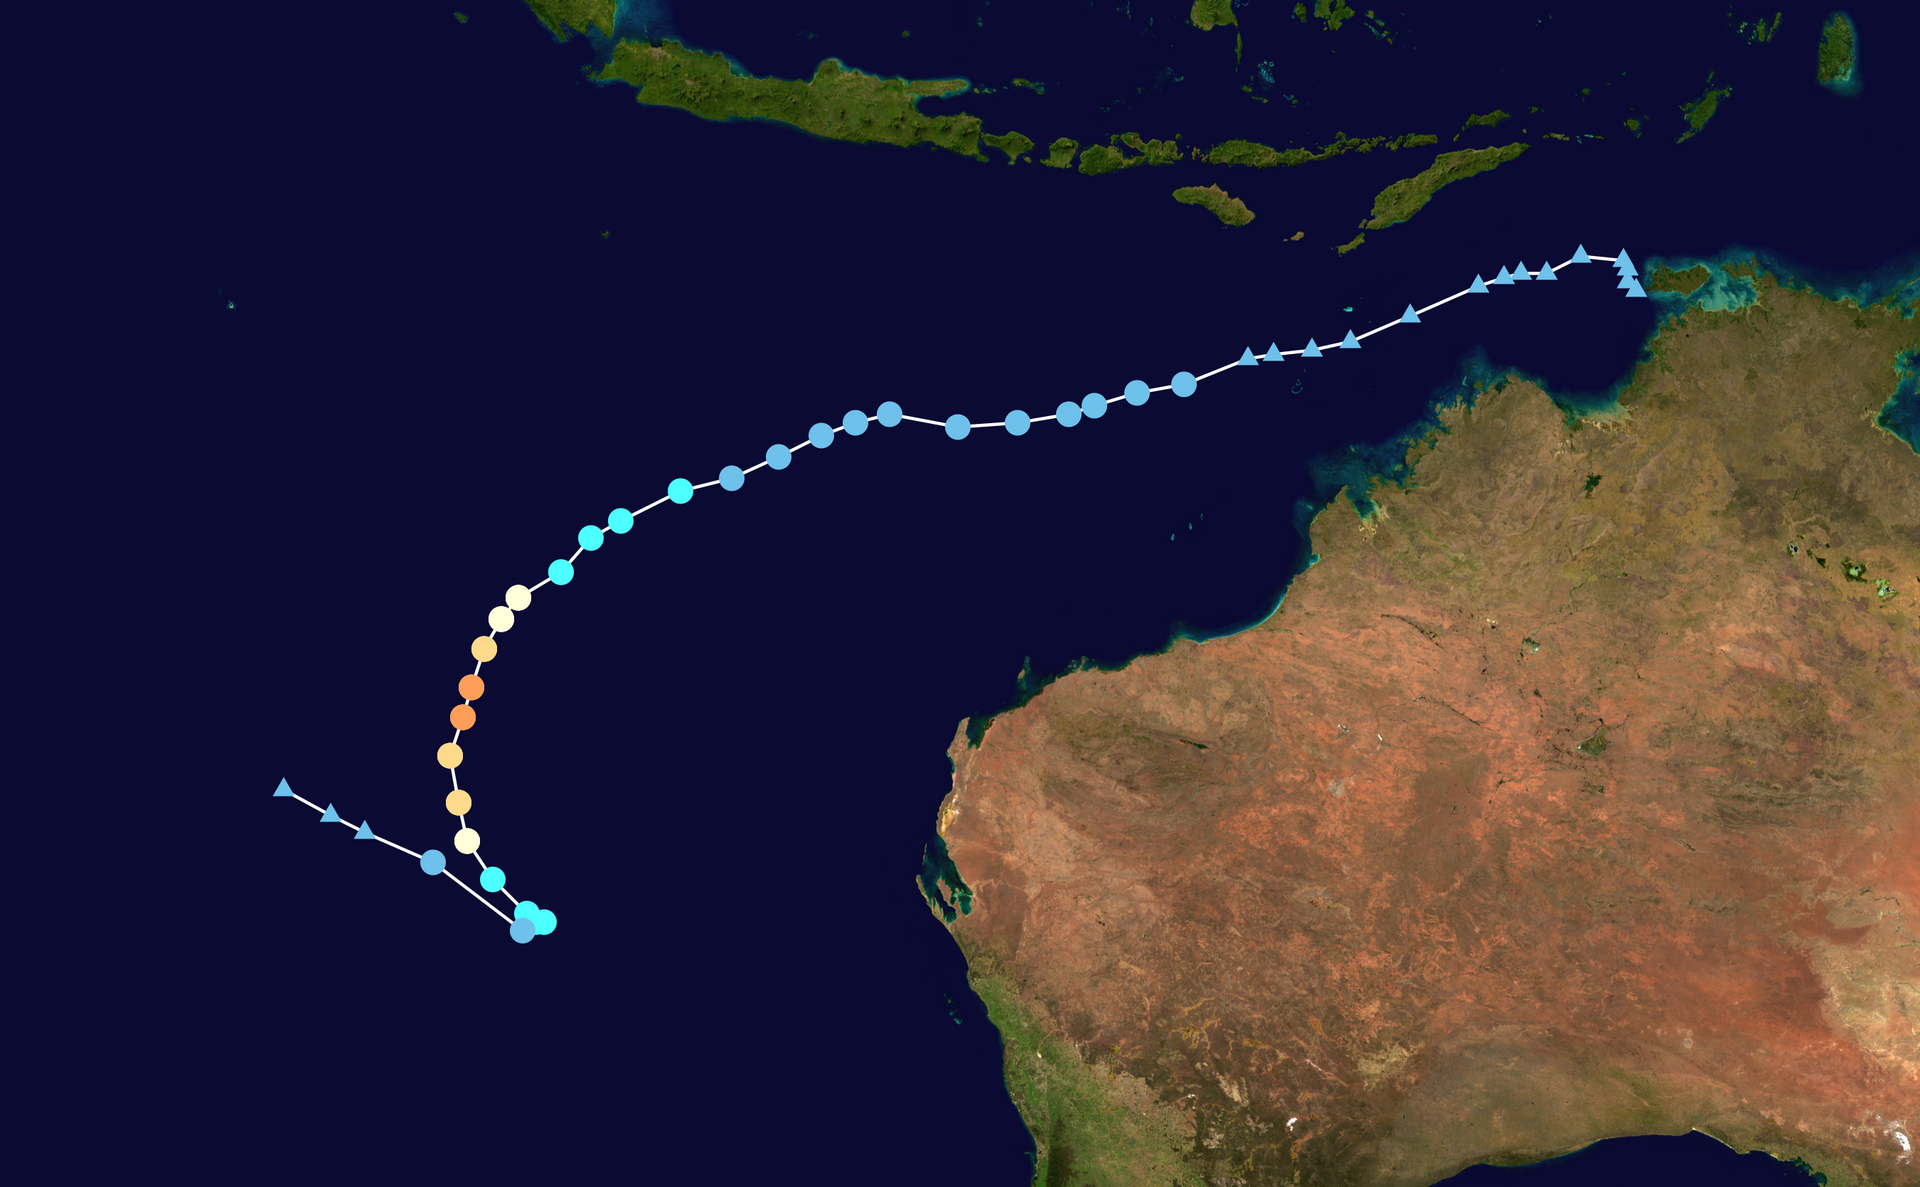
On 18 February, the Bureau of Meteorology (BOM) designated Tropical Low 21U in the eastern side of the Indian Ocean. BOM later named the system Tropical Cyclone Bianca. The cyclone did not pose any significant threat to Western Australia. On 25 February, the storm peaked as a Category 4 severe tropical cyclone on the Australian cyclone scale and Category 3 on the SSHWS scale. Afterward, increasing wind shear and cooler sea surface temperatures caused the storm to rapidly weaken, dissipating on 27 February.
Tropical Cyclone 25U
17 Mar – 21 Mar
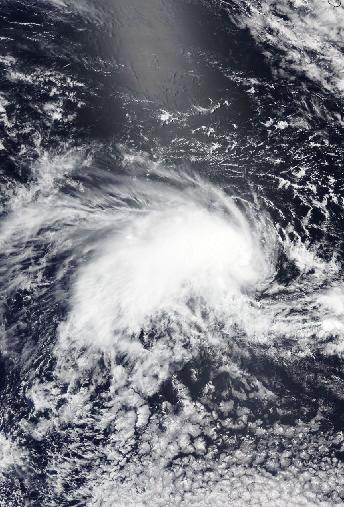
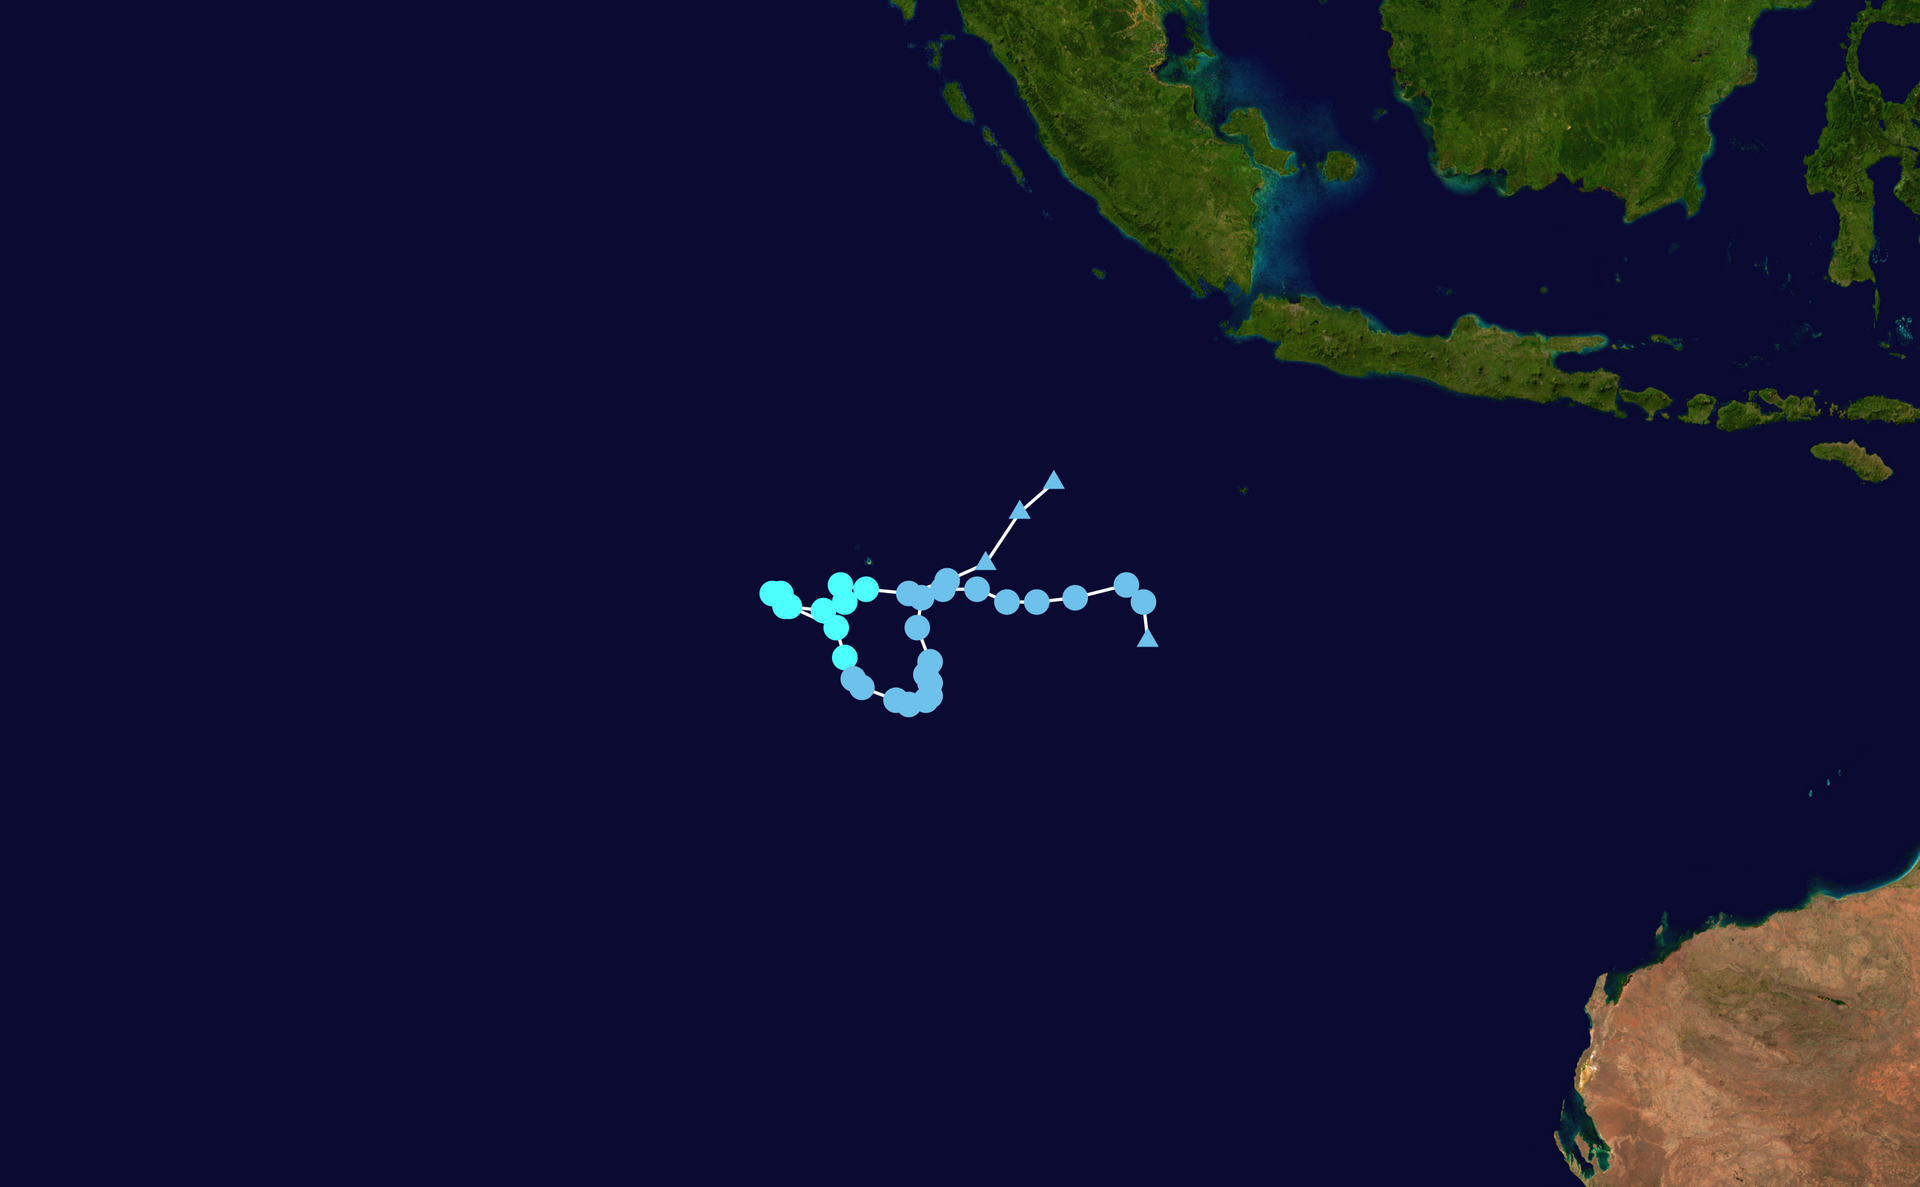
Tropical Low 25U formed in the South Indian Ocean on 17 March. On 18 March, Joint Typhoon Warning Center marked system as Tropical Cyclone 26S. 25U dissipated on 21 March and its remnants were absorbed by Tropical Low 27U, which would become Tropical Cyclone Courtney.
In late April, the BoM announced that based on post event reanalysis, Tropical Low 25U briefly reached tropical cyclone (TC) intensity near the Cocos Islands on 19 March, and thus has been reassigned as an unnamed tropical cyclone.
Severe Tropical Cyclone Courtney
22 Mar – 29 Mar
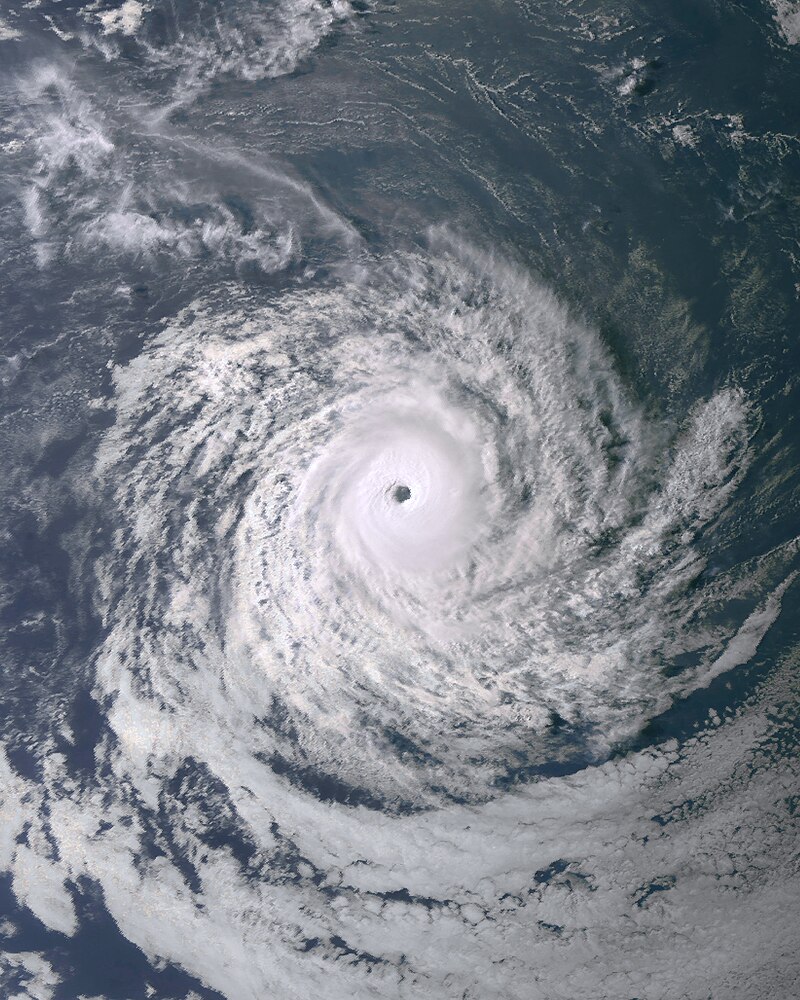
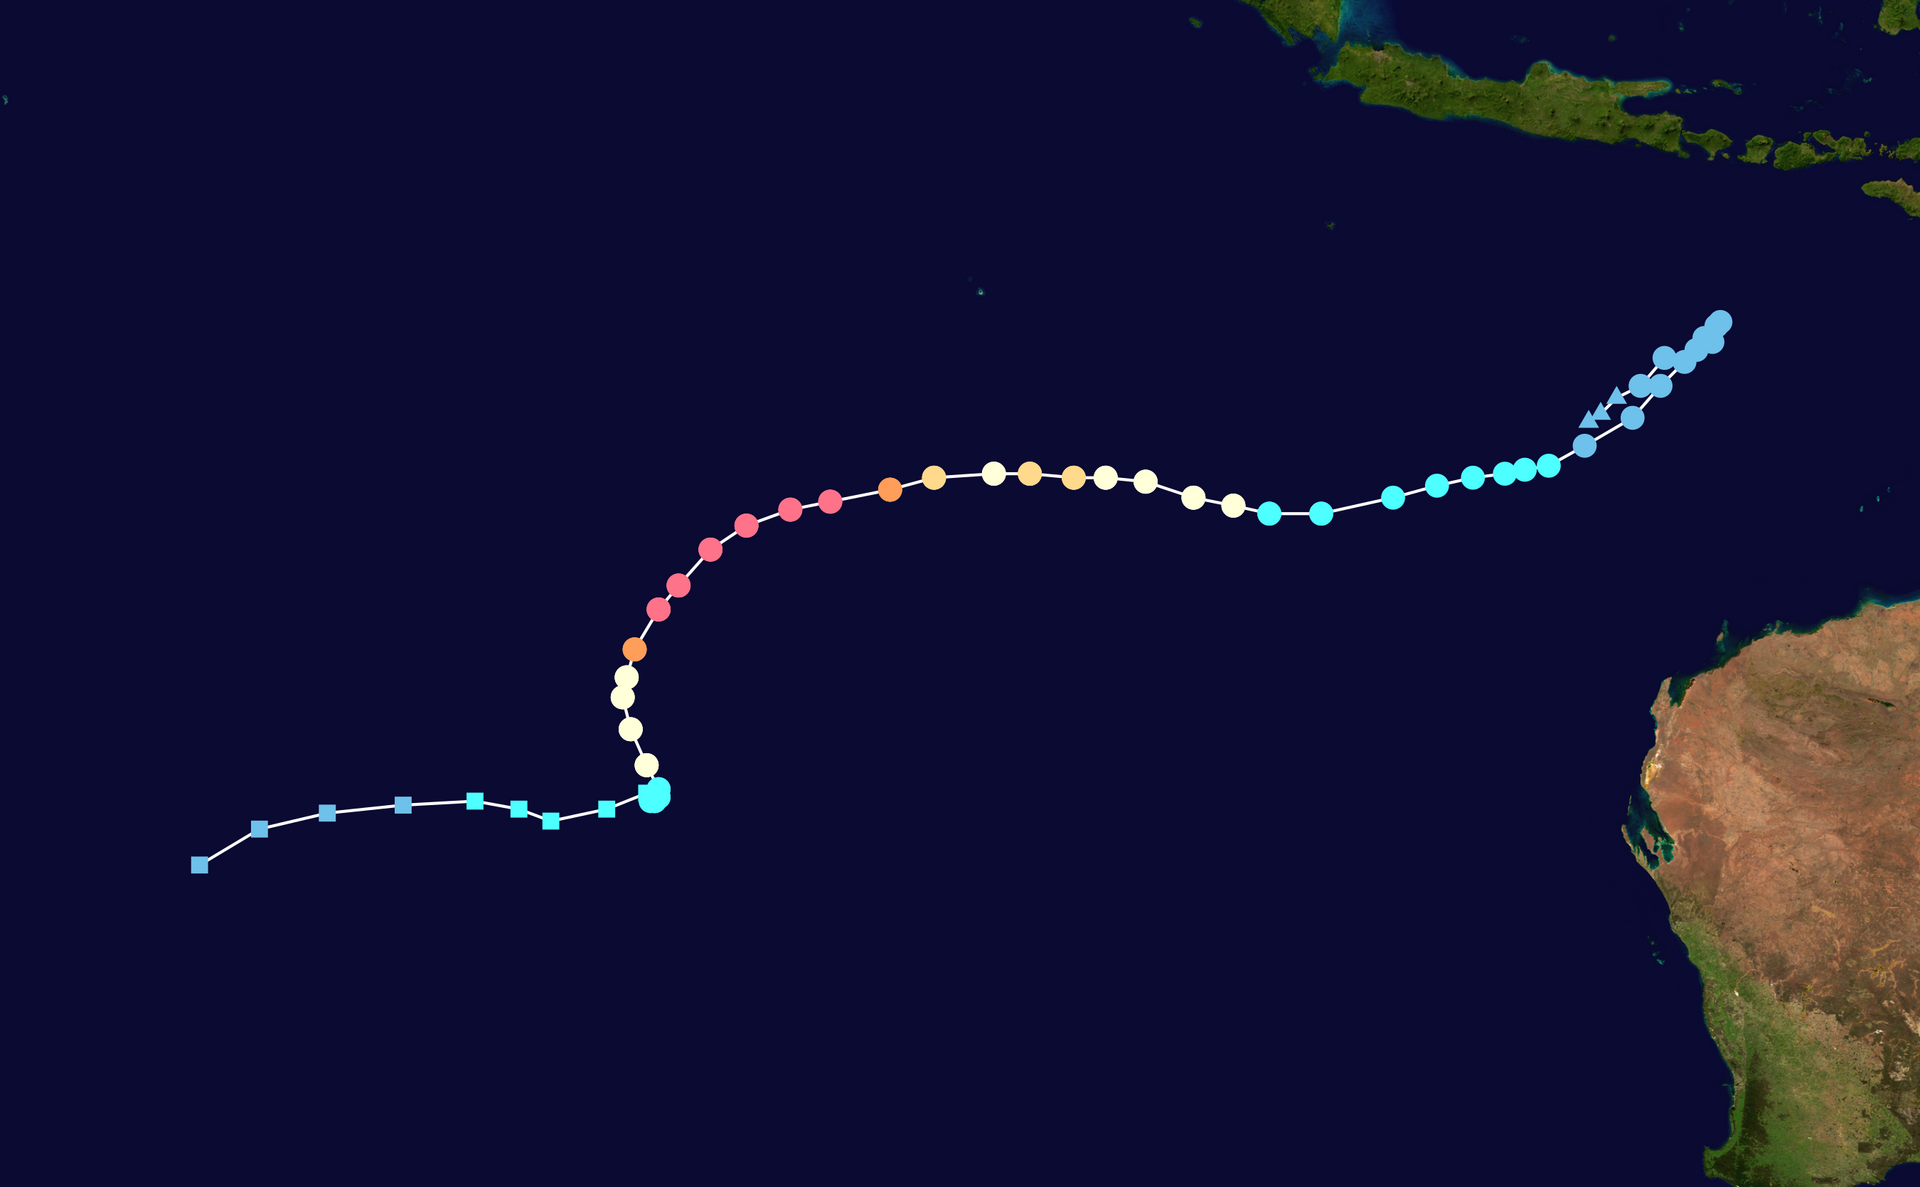
Tropical Low 27U formed on 22 March, located north-west of Australia. The system intensified into a category 1 tropical cyclone on 25 March, receiving the name Courtney. Courtney strengthened for a few days, reaching its peak intensity as a Category 5 tropical cyclone on 29 March. It moved into the South-West Indian Ocean later that day, still at peak intensity.
Tropical Cyclone Dianne
25 Mar – 29 Mar
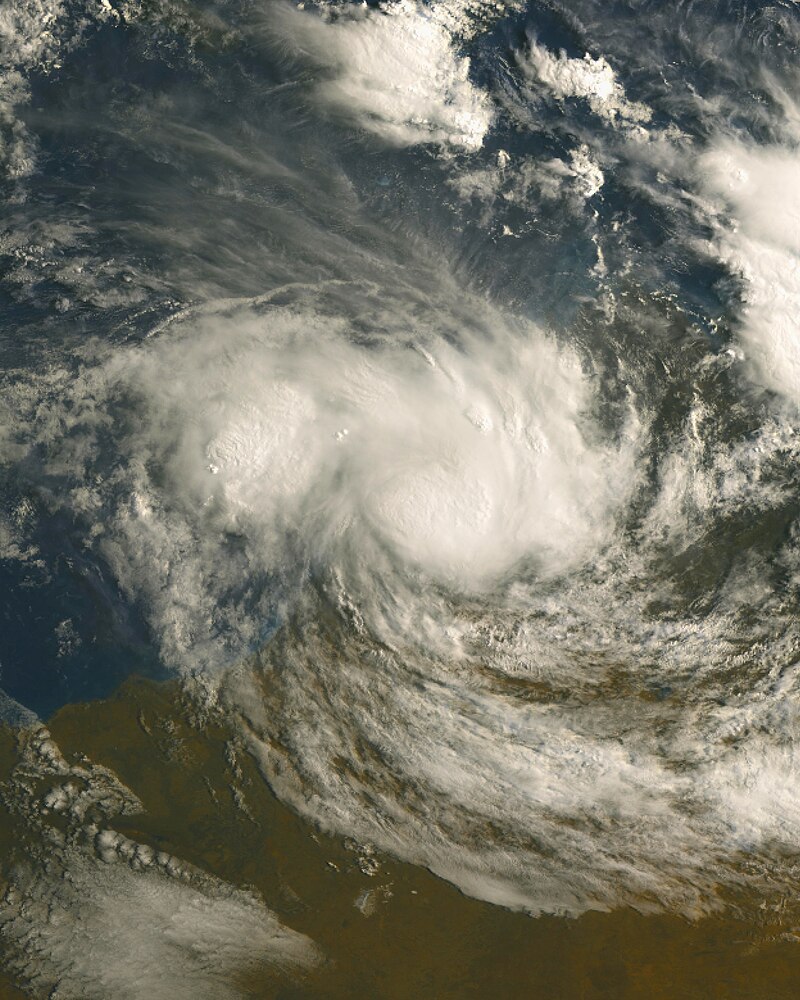
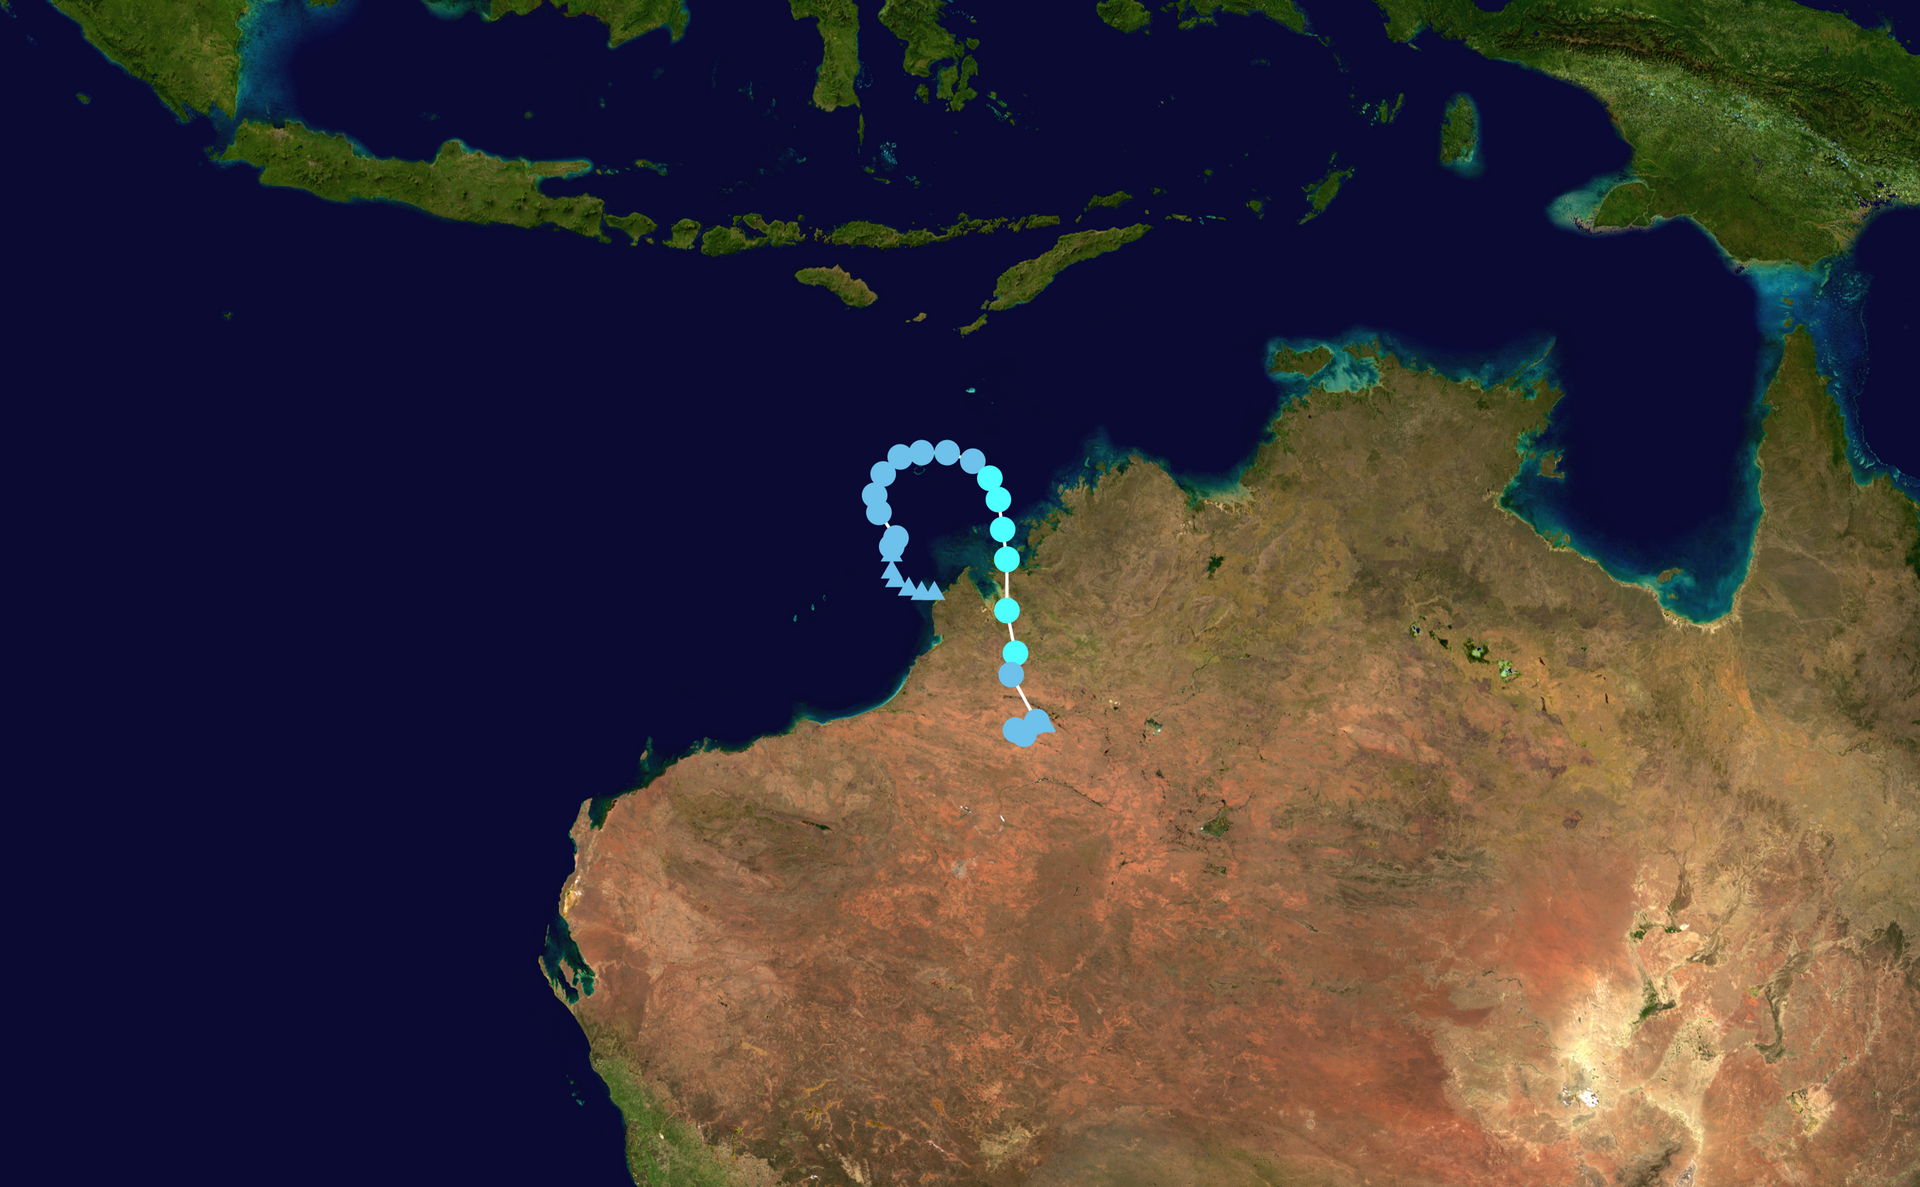
Tropical Low 28U formed north of Western Australia on 25 March. On 28 March, Joint Typhoon Warning Center marked system as Tropical Cyclone 28S. Tropical Low 28U gained gale force winds in the northern quadrants of the storm. A few hours later the Bureau of Meteorology named it Dianne on 28 March. It peaked at 85km/h. Dianne made landfall just east of Cockatoo Island in the Western Australia region a short time after being named.
130 mm of rain fell in Derby, causing street flooding. However, there were no reports of significant damage
Severe Tropical Cyclone Errol
9 Apr – 18 Apr
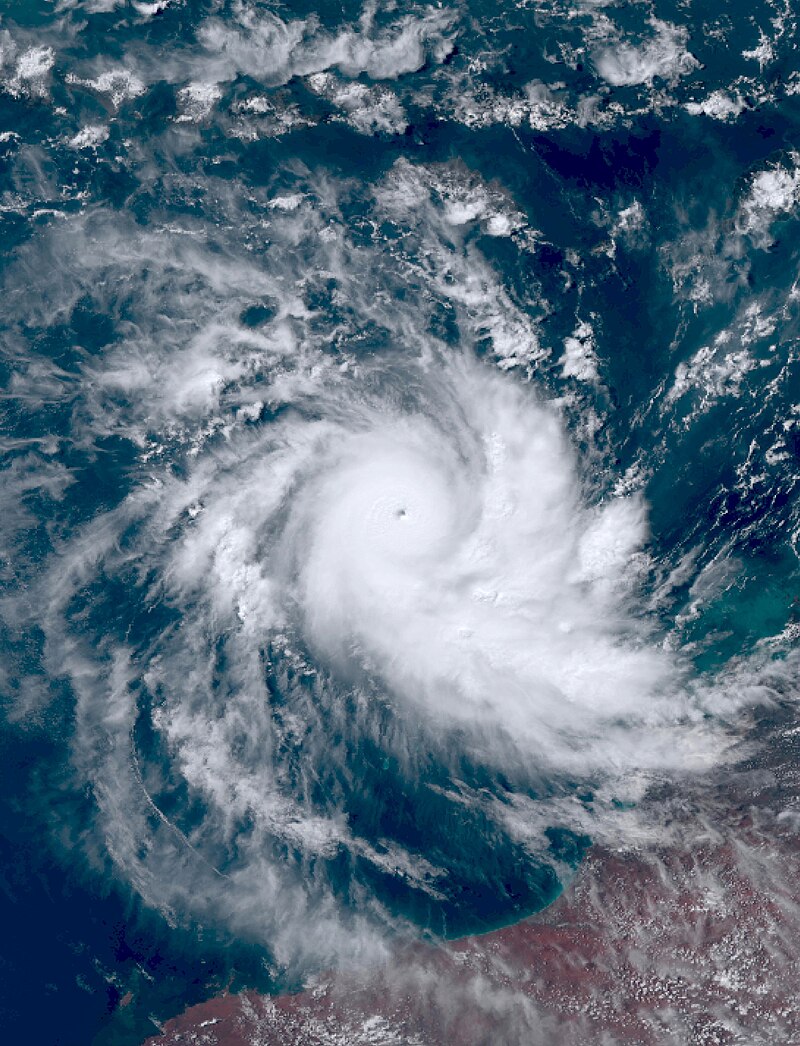
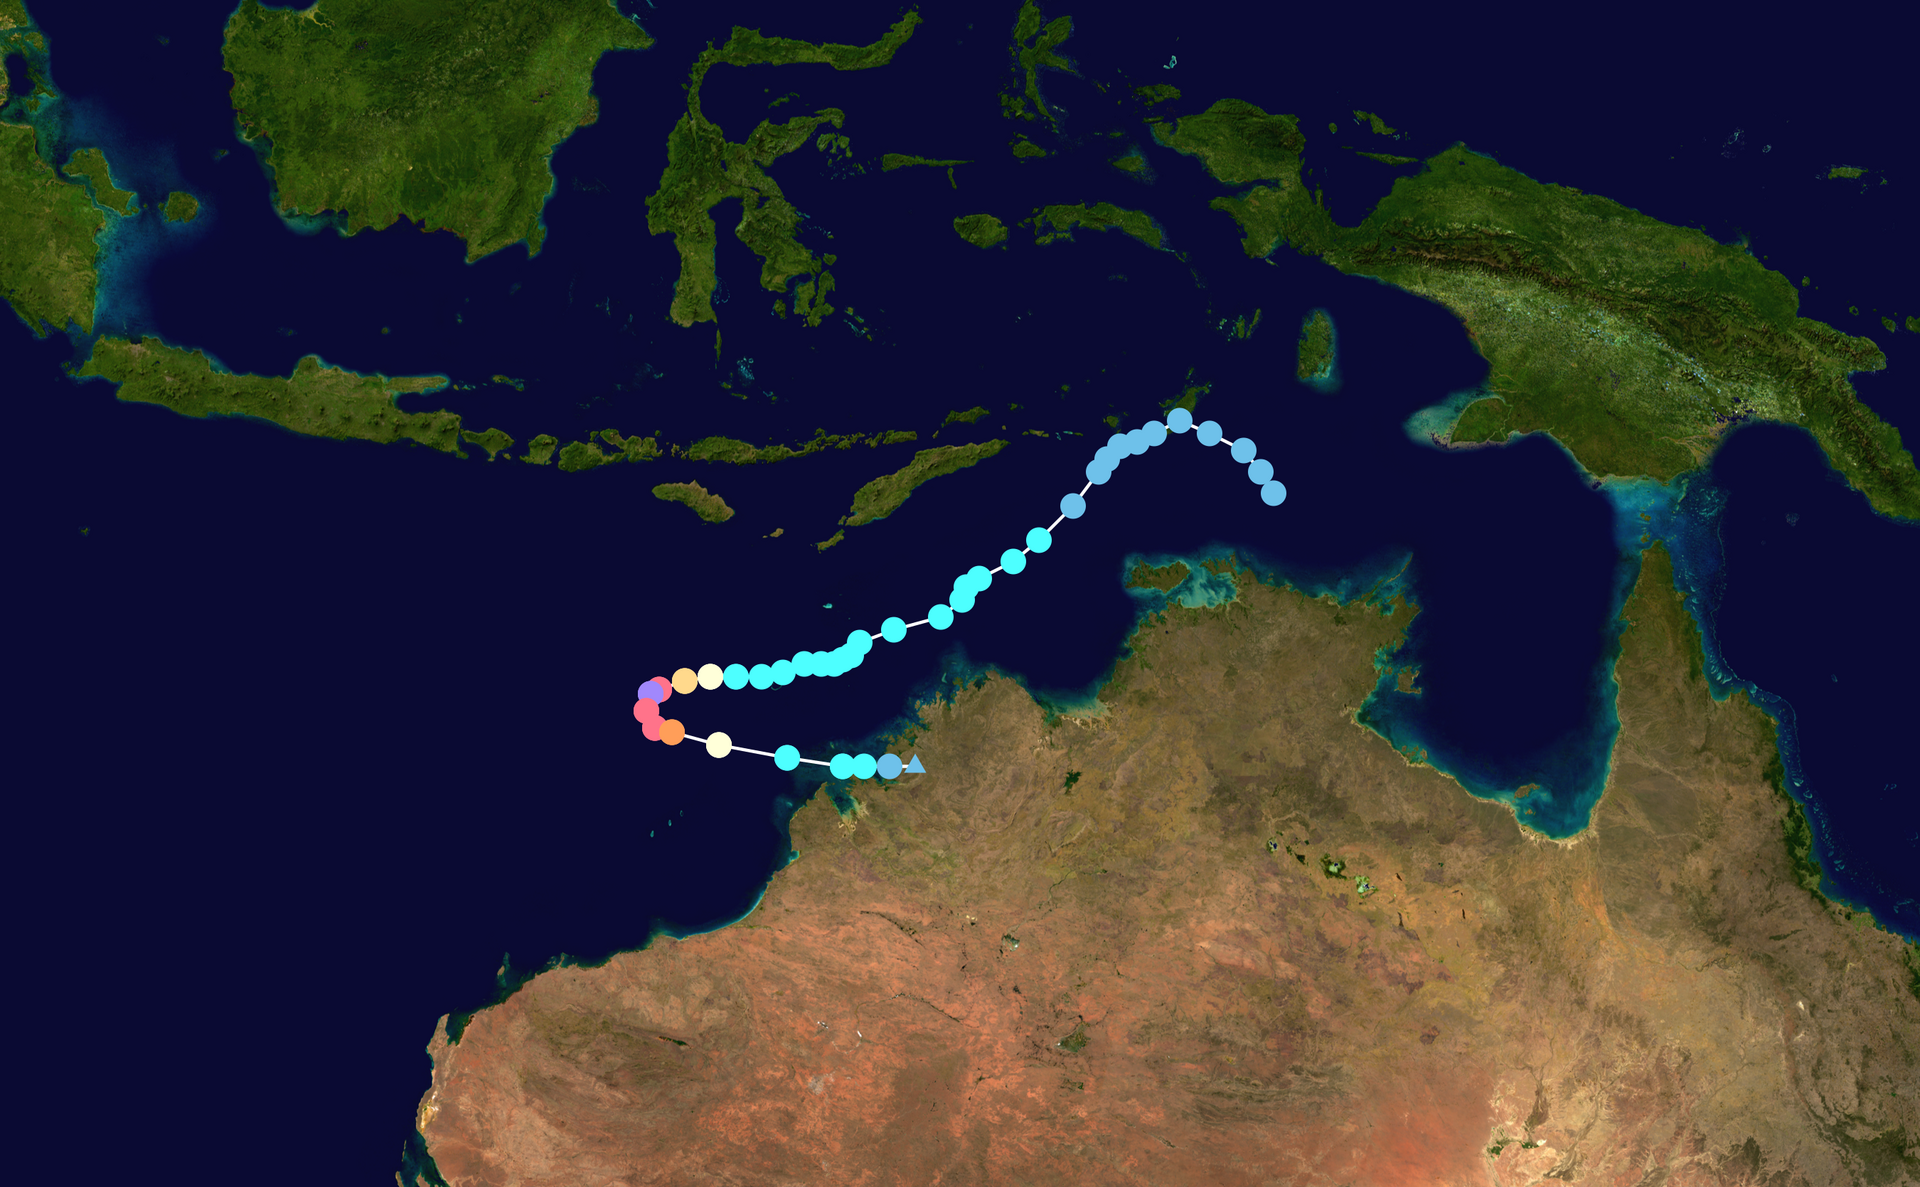
Errol formed on 9 April as Tropical Low 29U, and fluctuated from a Tropical Low to Category 1 from 12 April to 14 April. Starting late on 15 April, Errol begun a period of explosive deepening; 1-minute sustained winds increased from 100 km/h (65 mph) to 260 km/h (160 mph) in 24 hours and 120 km/h (75 mph) to 220 km/h (140 mph) in 12 hours, and the JTWC described it as ‘explosive and extreme rapid intensification’. Early on 16 April, it reached its peak intensity as a Category 5 equivalent tropical cyclone with 1-minute sustained winds of 260 km/h (160 mph), according to JTWC, while the BOM estimated 10-minute sustained winds of 185 km/h (115 mph) which made it a Category 4 severe tropical cyclone. On 16 April, Errol began to turn south, and on 17 April, as Errol took a sharp turn southeast-east, wind shear rapidly increased to 50 knots, causing Errol to rapidly weaken. It made landfall south of Kuri Bay on 18 April as a tropical low. After landfall, the BoM ceased advisories on the system as it fell below warning criteria.
Errol was a small tropical cyclone that brought heavy rain to the Northern Kimberley coast including Derby and Kalumburu on 18 and 19 April. Kalumburu received 160.8 mm of rainfall in the 24 hours to 9 am on 19 April. Errol is the latest tropical cyclone to form or move into the Australian region since Karim which formed on 7th May 2022.
-Nikko-
Note:
*Data is based on my personal weather station
** Tindal is the site location used for Katherine
***Cyclone Overviews sourced from https://en.wikipedia.org/wiki/2024%E2%80%9325_Australian_region_cyclone_season
Observed and average data is sourced from BoM.